Tracer une régression

Tests A/B en R

Lauryn Burleigh

Data Scientist

Droite linéaire

cor.test(~ Enjoy + Time, data = pizza, 
         method = "pearson")
library(ggplot2)
ggplot(pizza, aes(x = Enjoy, 
                  y = Time)) + 
  geom_point()
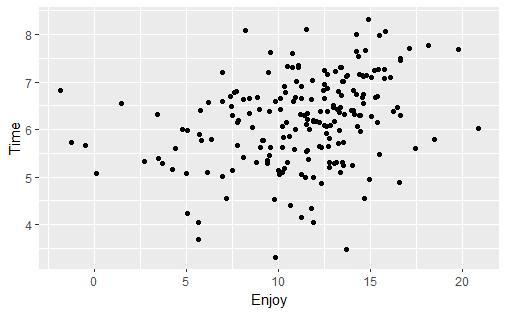
Nuage de points montrant une corrélation positive : temps pour manger la pizza (axe y) vs appréciation (axe x).

ggplot(pizza, aes(x = Enjoy, 
                  y = Time)) + 
  geom_point() +
  geom_smooth(method = "lm")
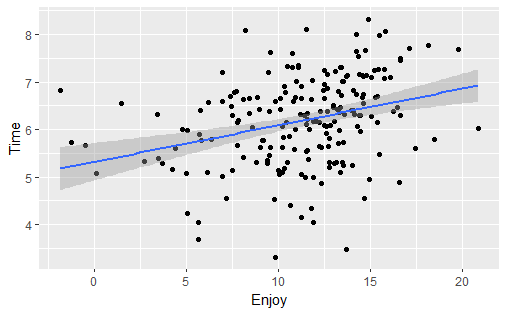
Même nuage de points avec ligne bleue d'ajustement linéaire et intervalle de confiance.

Tests A/B en R

Prédiction linéaire

linear <- lm(Time ~ Enjoy, 
                data = Pizza) 
Enjoy  <- 12
topredict <-  data.frame(Enjoy) 
prediction <- predict(linear, 
                     newdata = topredict) 

ggplot(pizza, aes(x = Enjoy, y = Time)) + 
  geom_point() +
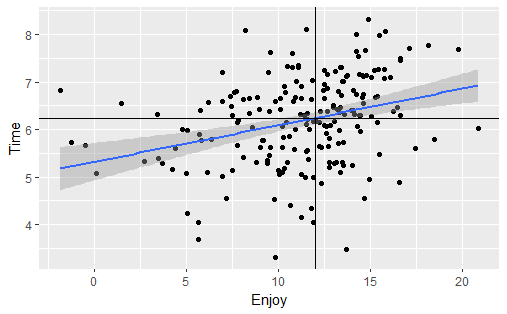
  geom_smooth(method = "lm") +  
  geom_hline(yintercept = prediction) + 
  geom_vline(xintercept = Enjoy) 

Nuage de points avec ligne bleue d'ajustement linéaire, plus des lignes noires à x = 12 et y = 6,24.

Tests A/B en R

Indiquer les groupes

ggplot(pizza, aes(x = Enjoy, y = Time, 
                  color = Topping)) + 
  geom_point() +
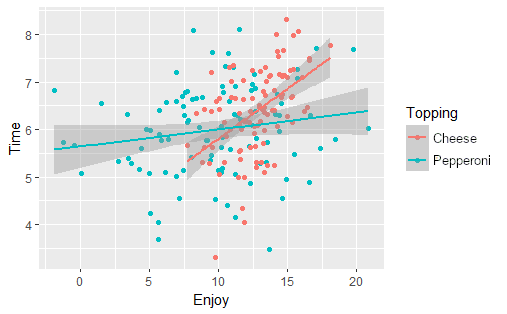
  geom_smooth(method = "lm") 

Nuage de points par groupe : Pepperoni en rose et Fromage en bleu, chacun avec sa droite d'ajustement.

Tests A/B en R

Indiquer les groupes

ggplot(pizza, aes(x = Enjoy, 
                  y = Time)) + 
  geom_point(aes(colour = Topping)) +
  geom_smooth(method = "lm")

Nuage de points avec ligne bleue d'ajustement ; points Fromage en rose et Pepperoni en bleu.

Tests A/B en R

Courbe logistique

ggplot(pizza, aes(x = Enjoy, 
                  y = EatAgain)) + 
  geom_point(aes(colour = Topping)) +
  geom_smooth(method = "glm",  
              method.args = 
                 list(family = 
                      "binomial"))

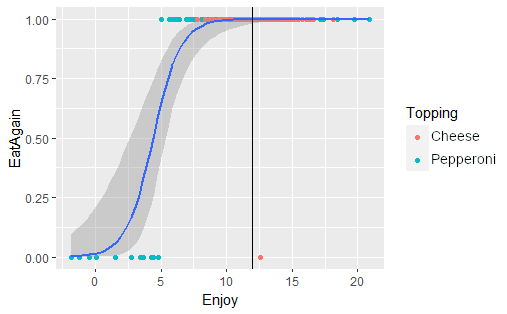
Nuage de points : appréciation (axe x) vs « manger de nouveau » (axe y) avec points à 0 ou 1 et courbe logistique.

Tests A/B en R

Prédiction logistique

Enjoy  <- 12

ggplot(pizza2, aes(x = Enjoy, 
                   y = EatAgain)) + 
  geom_point(aes(colour = Topping)) +
  geom_smooth(method = "glm",  
              method.args = 
              list(family = 
                   "binomial")) +
  geom_vline(xintercept = Enjoy) 

Nuage de points : appréciation (axe x) vs « manger de nouveau » (axe y), points à 0 ou 1 (Pepperoni en rose, Fromage en bleu), courbe logistique et ligne verticale noire à x = 12.

Tests A/B en R

Passons à la pratique !

Tests A/B en R

Preparing Video For Download...