Visualiser votre stratégie

Négociation financière en R

Ilya Kipnis

Professional Quantitative Analyst and R programmer

La fonction chart.Posn

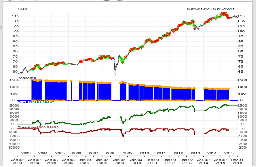
chart.Posn() offre un premier aperçu du rendement de la stratégie

chart.Posn(portfolio = portfolio.st, Symbol = "LQD")
Négociation financière en R

Aperçu visuel

Négociation financière en R

Ajouter des indicateurs aux graphiques

Recalculer les indicateurs hors stratégie pour les ajouter au graphique

sma50 <- SMA(x = Cl(LQD), n = 50)
sma200 <- SMA(x = Cl(LQD), n = 200)
dvo <- DVO(HLC = HLC(LQD), nAvg = 2, percentLookback = 126)

Ajouter les indicateurs avec la commande add_TA(). Utilisez on = 1 pour les superposer au graphique des prix

chart.Posn(Portfolio = portfolio.st, symbol = "LQD")
add_TA(sma50, on = 1, col = "blue")
add_TA(sma200, on = 1, col = "red")add_TA(dvo)
Négociation financière en R

Zoom avant

  • Utilisez zoom_Chart("date1/date2") pour examiner de plus près
  • zoom_Chart("2007-08/2007-12") donne :

Négociation financière en R

Passons à la pratique !

Négociation financière en R

Preparing Video For Download...