Loi normale multivariée

Lois de probabilité multivariée en R

Surajit Ray

Professor, University of Glasgow

Loi normale univariée
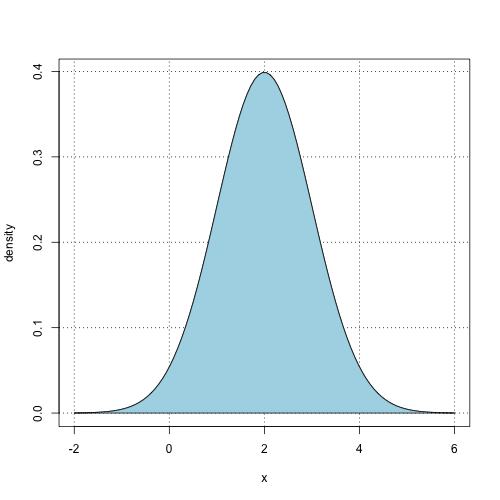
                                                               Normale univariée, moyenne 2 et variance 1

Lois de probabilité multivariée en R

Forme de densité d'une normale bivariée animation
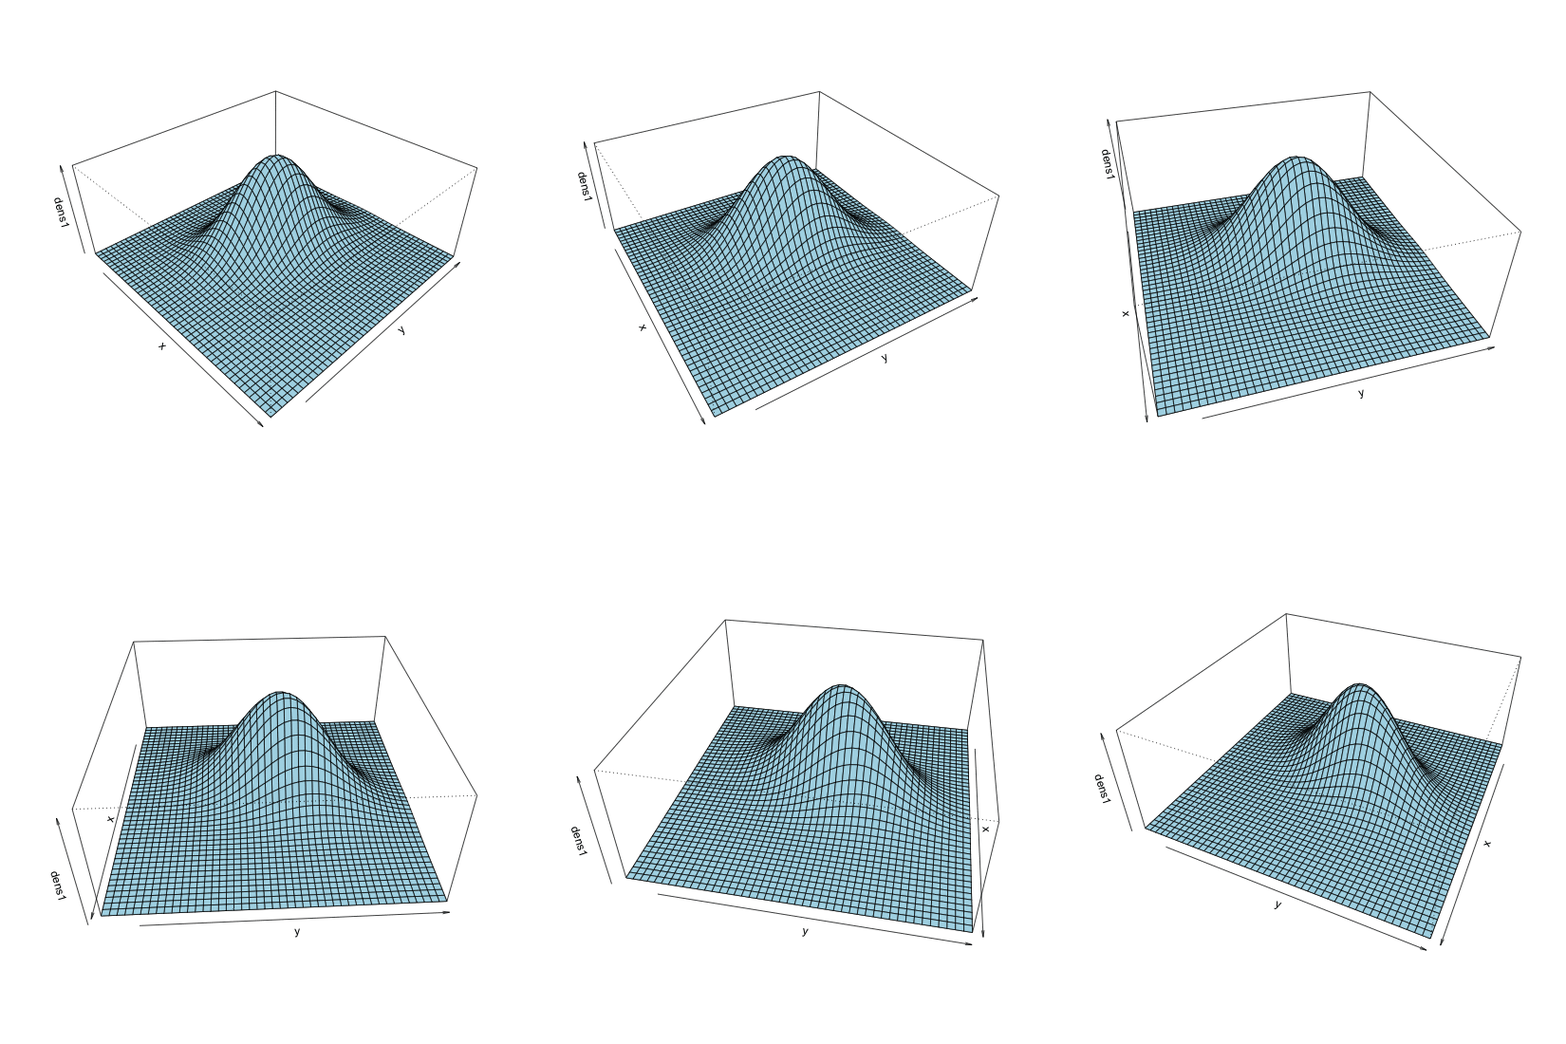
Lois de probabilité multivariée en R

Densité bivariée normale - graphique 3D
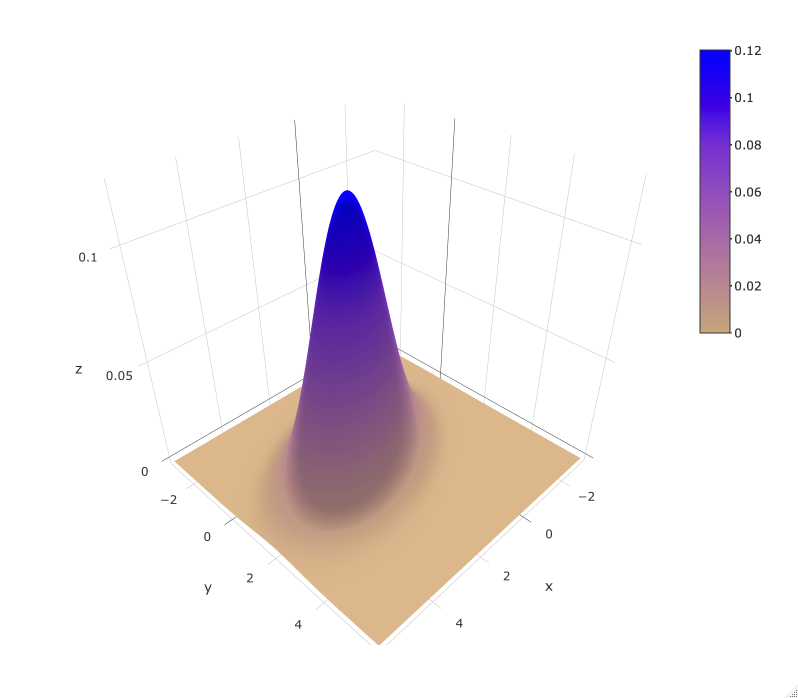
 

${\mu}={\begin{pmatrix} 1 \\ 2 \end{pmatrix}},\quad { \Sigma }={\begin{pmatrix} 1 & 0.5 \\ 0.5 & 2 \end{pmatrix}}$

surface

Lois de probabilité multivariée en R

Densité bivariée normale - courbes de niveau
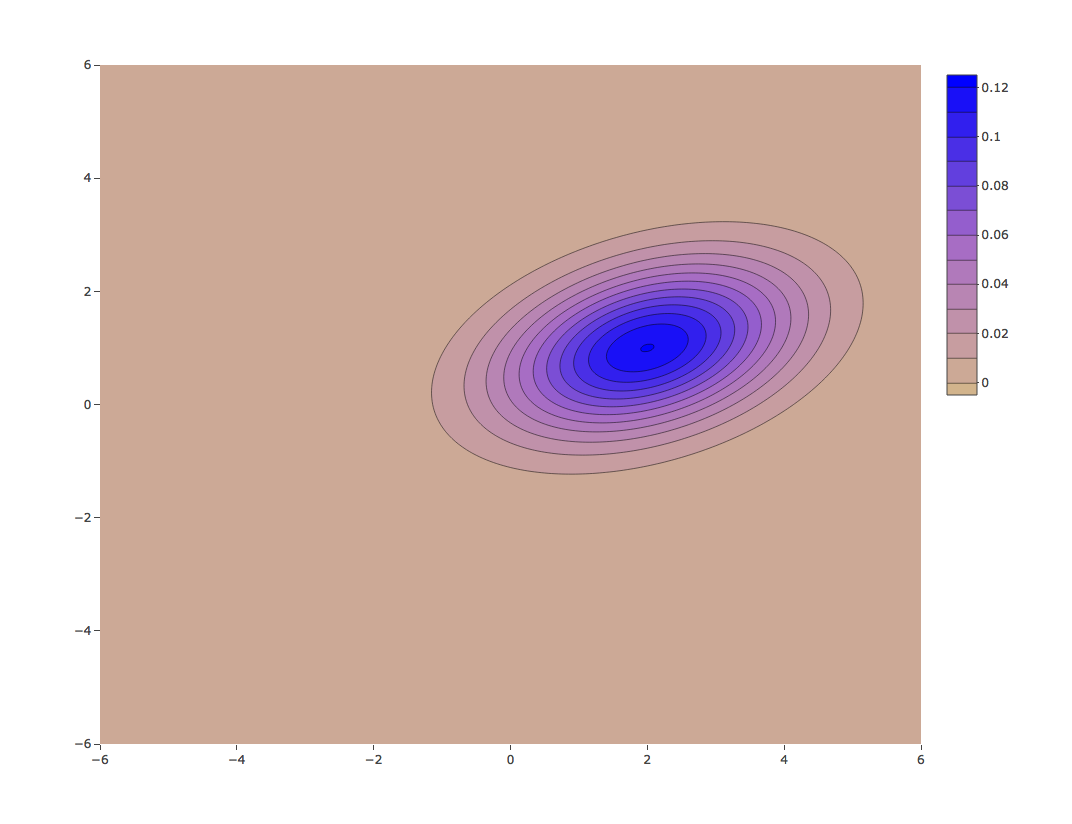
 

${\mu}={\begin{pmatrix} 1 \\ 2 \end{pmatrix}},\quad { \Sigma }={\begin{pmatrix} 1 & 0.5 \\ 0.5 & 2 \end{pmatrix}}$

contour

Lois de probabilité multivariée en R

Densité bivariée normale avec une autre moyenne
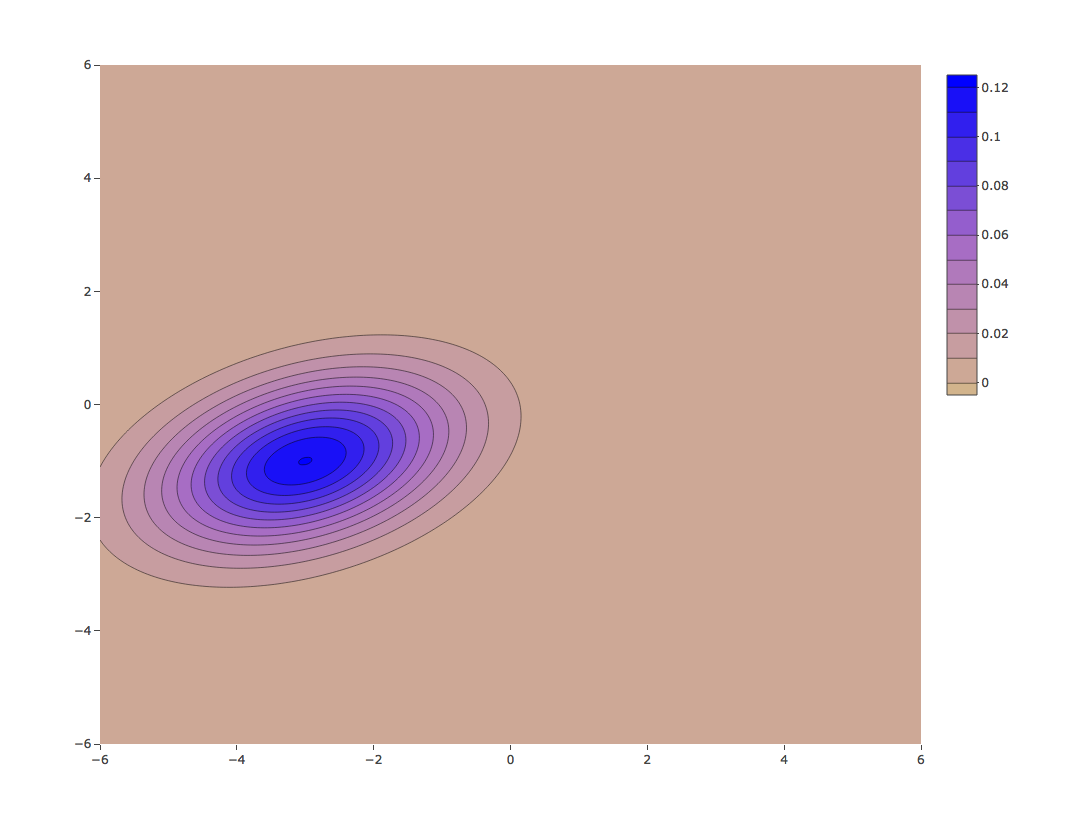
 

${\mu}={\begin{pmatrix} -1 \\ -3 \end{pmatrix}},\quad { \Sigma }={\begin{pmatrix} 1 & 0.5 \\ 0.5 & 2 \end{pmatrix}}$

Lois de probabilité multivariée en R

Densité bivariée normale avec une autre variance
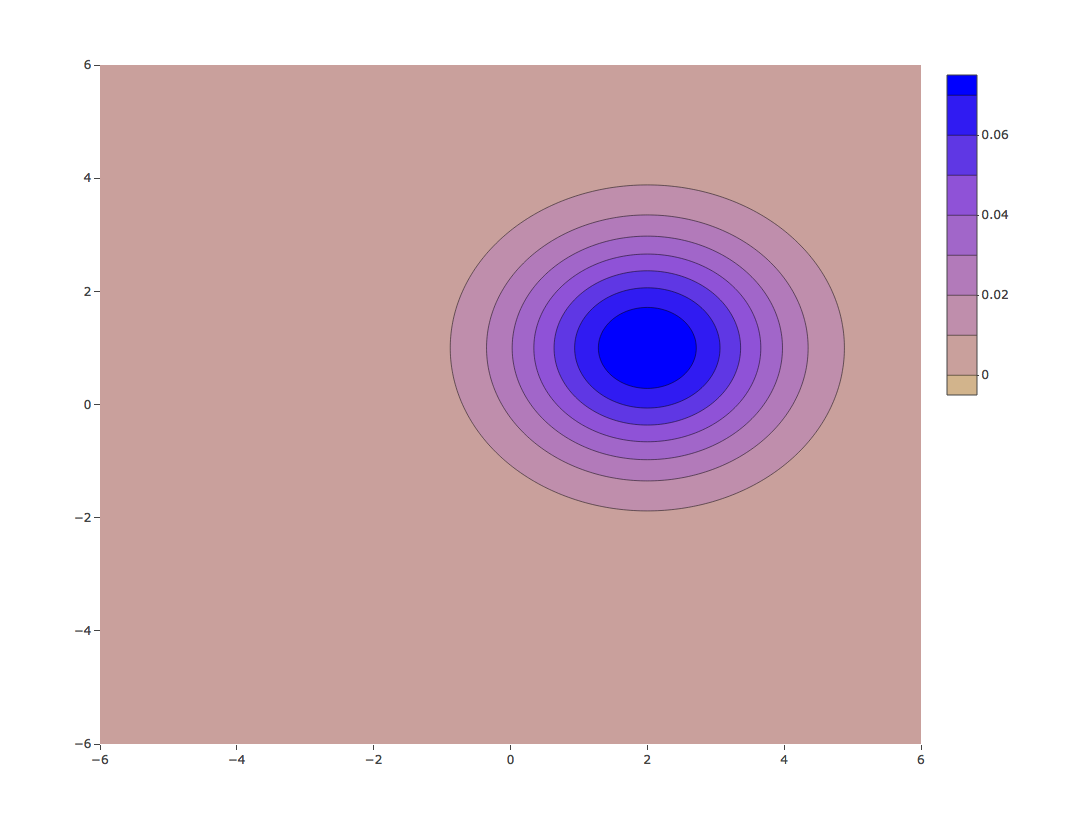
 

${\mu}={\begin{pmatrix}\phantom{-}1 \\\phantom{-}2 \end{pmatrix}} ,\quad { \Sigma }={\begin{pmatrix}2 & 0 \\ 0 & 2 \end{pmatrix}}$

Lois de probabilité multivariée en R

Densité bivariée normale avec forte corrélation
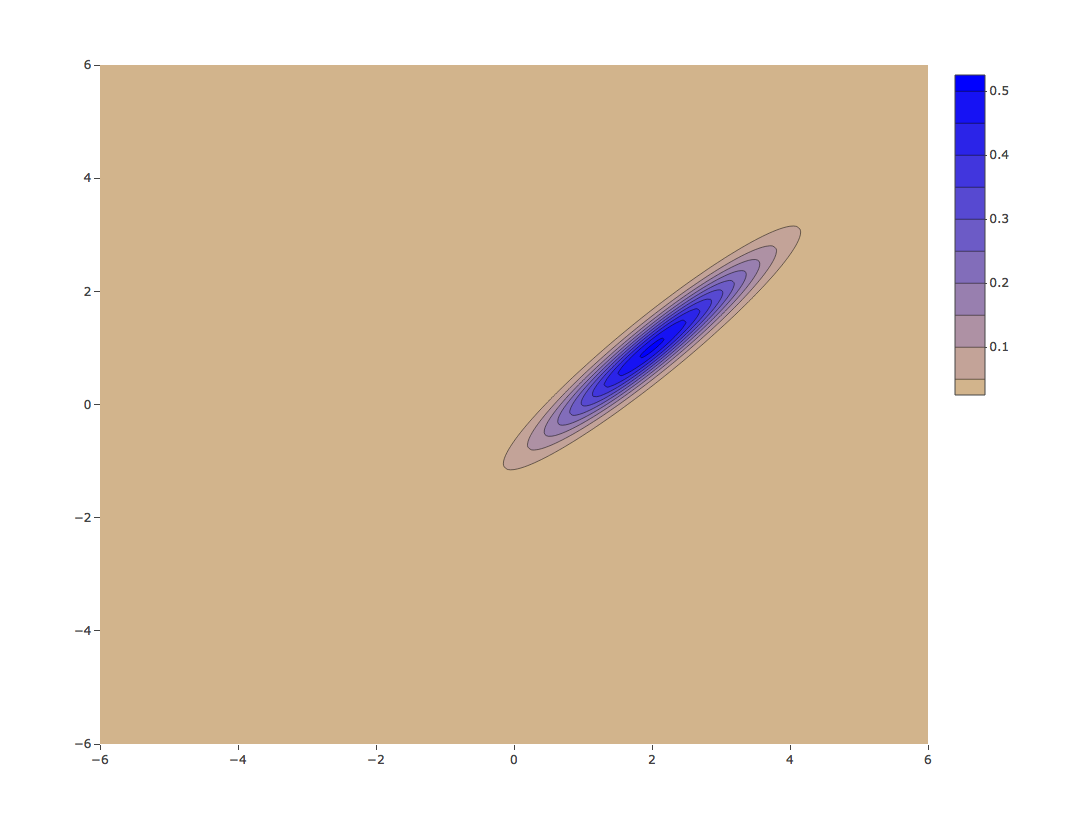
 

${\mu}={\begin{pmatrix}\phantom{-}1 \\\phantom{-}2 \end{pmatrix}},\quad { \Sigma }={\begin{pmatrix}1& 0.95 \\0.95 & 1 \end{pmatrix}}$

Lois de probabilité multivariée en R

Fonctions de distributions statistiques en R

Lois de probabilité multivariée en R

Fonctions de distributions statistiques en R

  • La première lettre indique
    • p pour « probability »
    • q pour « quantile »
    • d pour « density »
    • r pour « random »
Lois de probabilité multivariée en R

La fonction rmvnorm

library(mvtnorm)
rmvnorm(n, mean , sigma)

Il faut préciser :

  • n le nombre d'échantillons
  • mean la moyenne de la distribution
  • sigma la matrice variance-covariance
Lois de probabilité multivariée en R

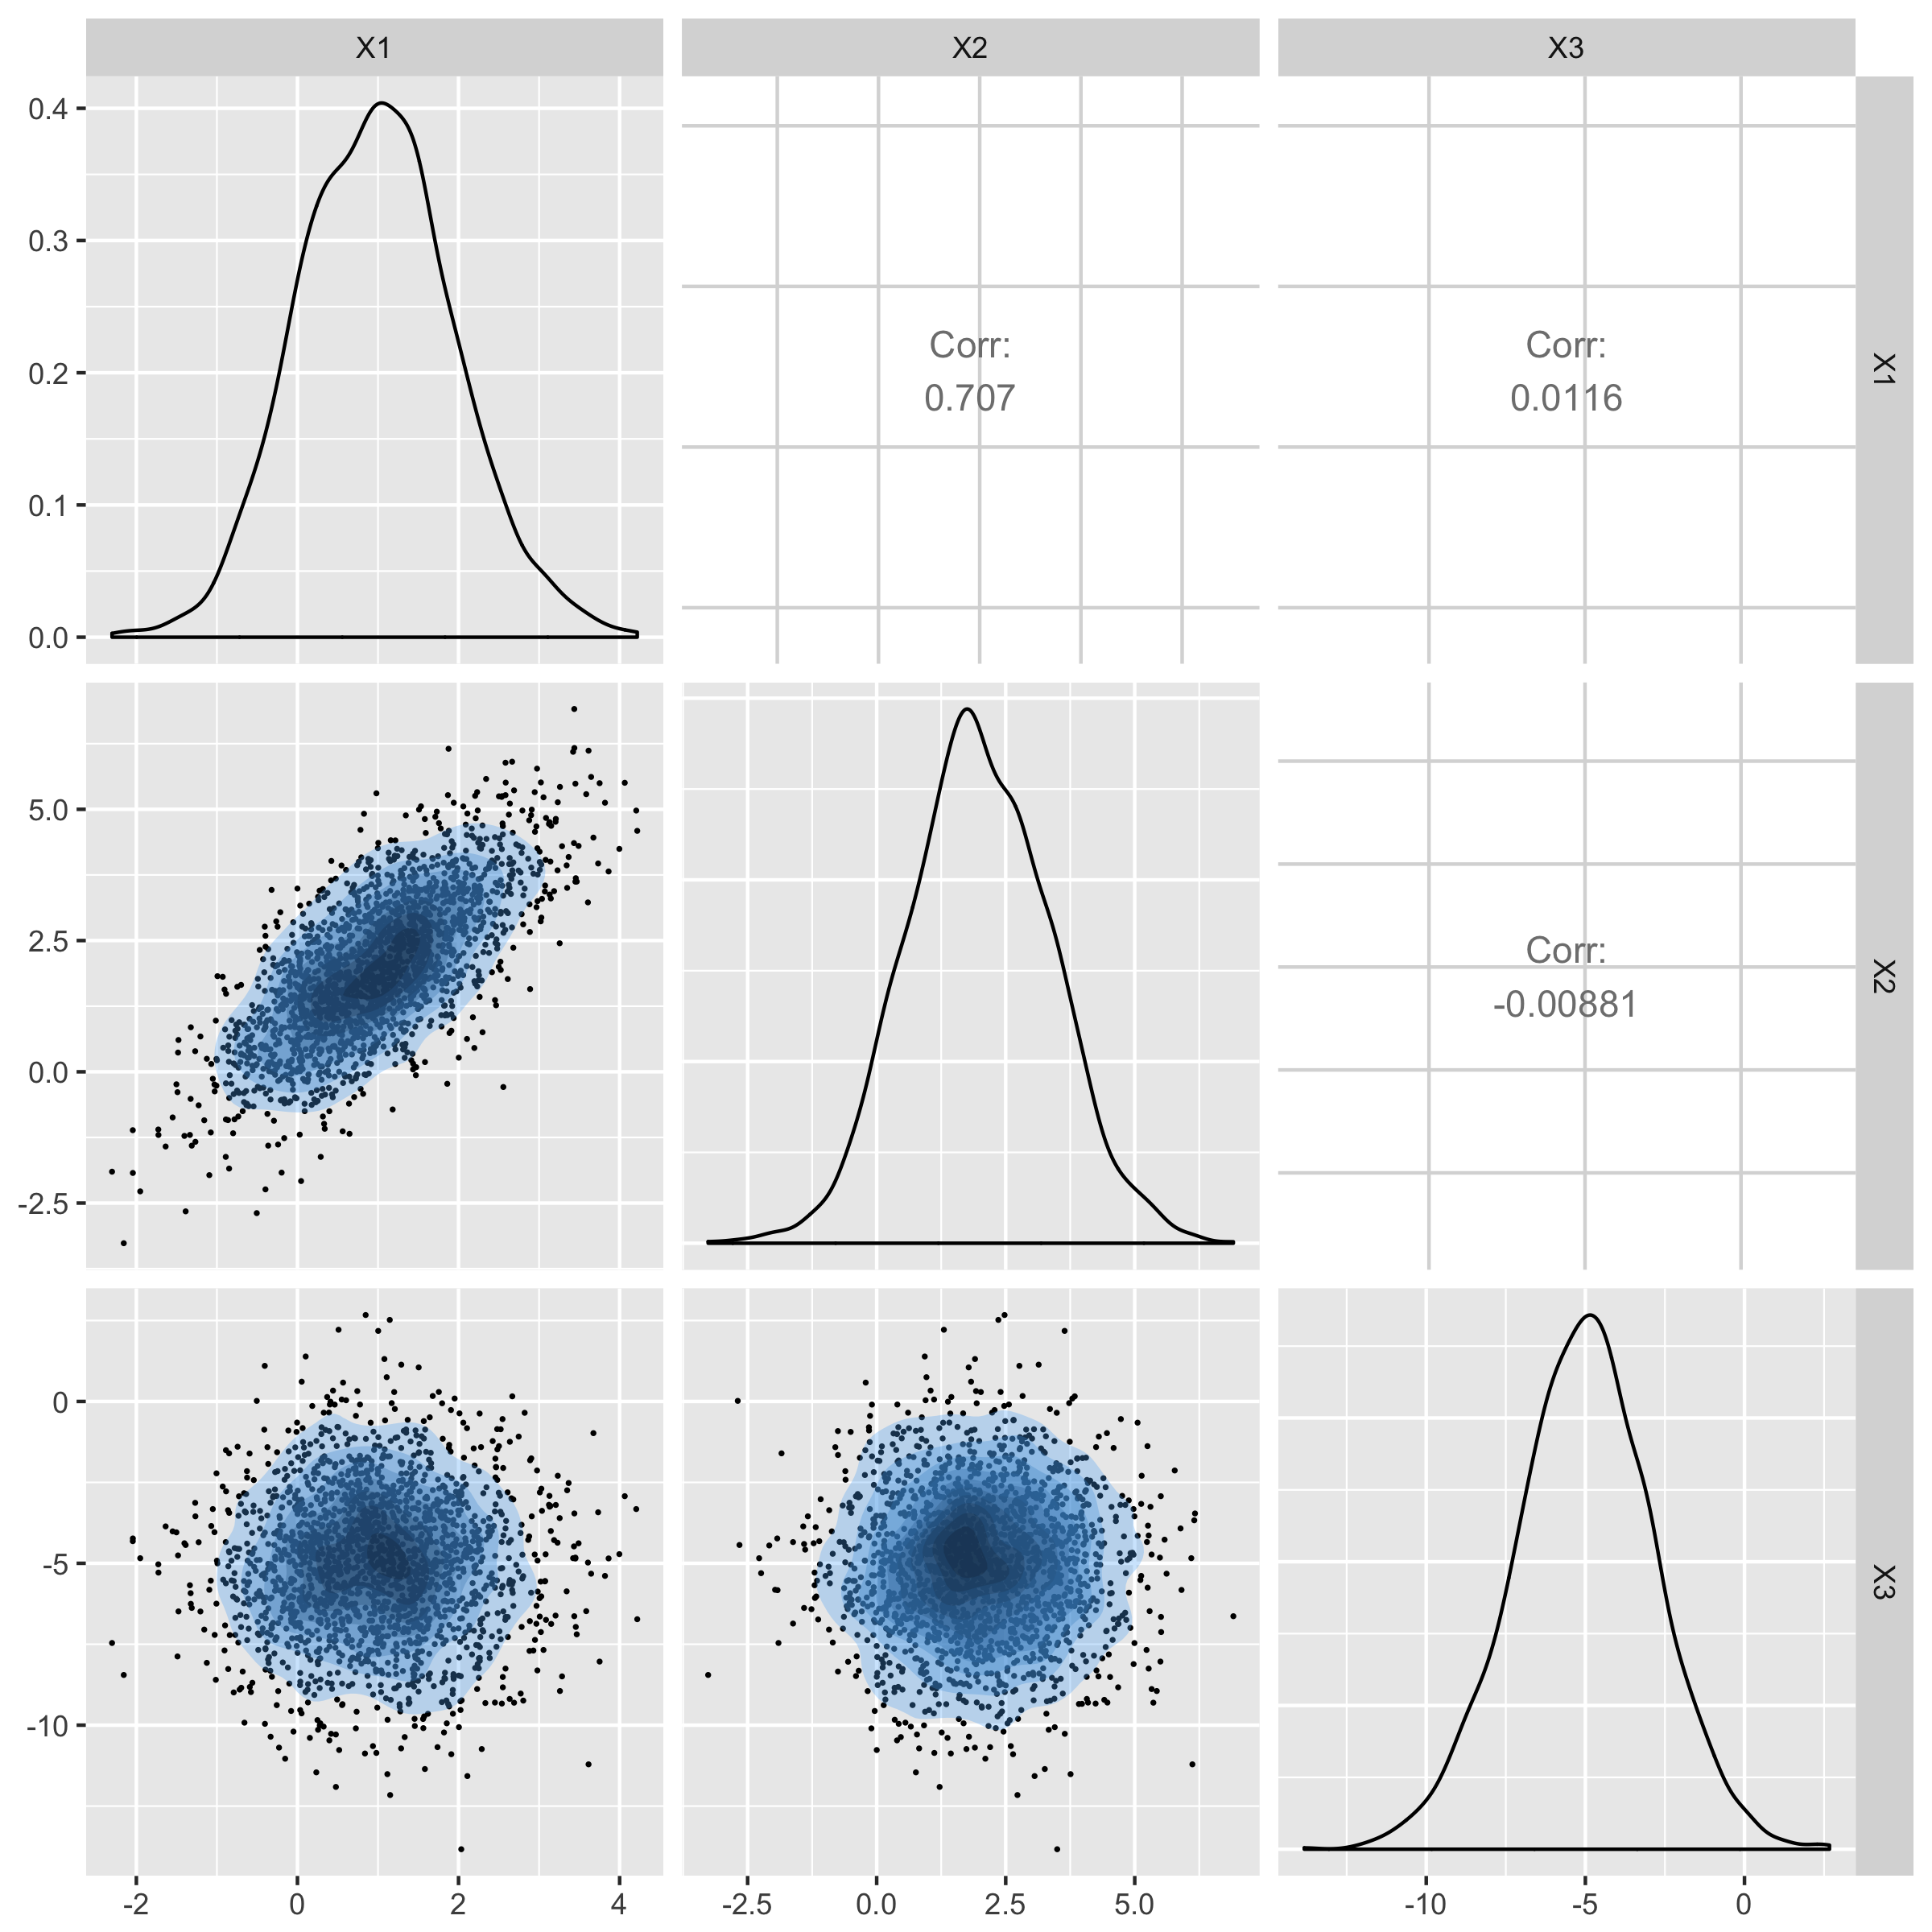
Utiliser rmvnorm pour générer des échantillons aléatoires

Générez 1 000 échantillons d'une normale à 3 dimensions avec

$$ \mu= \begin{pmatrix} 1 \\ 2 \\ -5 \end{pmatrix} \Sigma={\begin{pmatrix} 1 & 1 & 0 \\ 1 & 2 & 0 \\ 0 & 0 & 5 \end{pmatrix}} $$


mu1 <- c(1, 2, -5) 
sigma1 <- matrix(c(1,1,0,
                  1,2,0,
                  0,0,5),3,3)
set.seed(34)                  
rmvnorm(n = 1000, mean = mu1, sigma = sigma1)
Lois de probabilité multivariée en R

Diagramme des échantillons générés simulation
Lois de probabilité multivariée en R

Passons à la pratique !

Lois de probabilité multivariée en R

Preparing Video For Download...