Découpage en facettes avec TrelliscopeJS
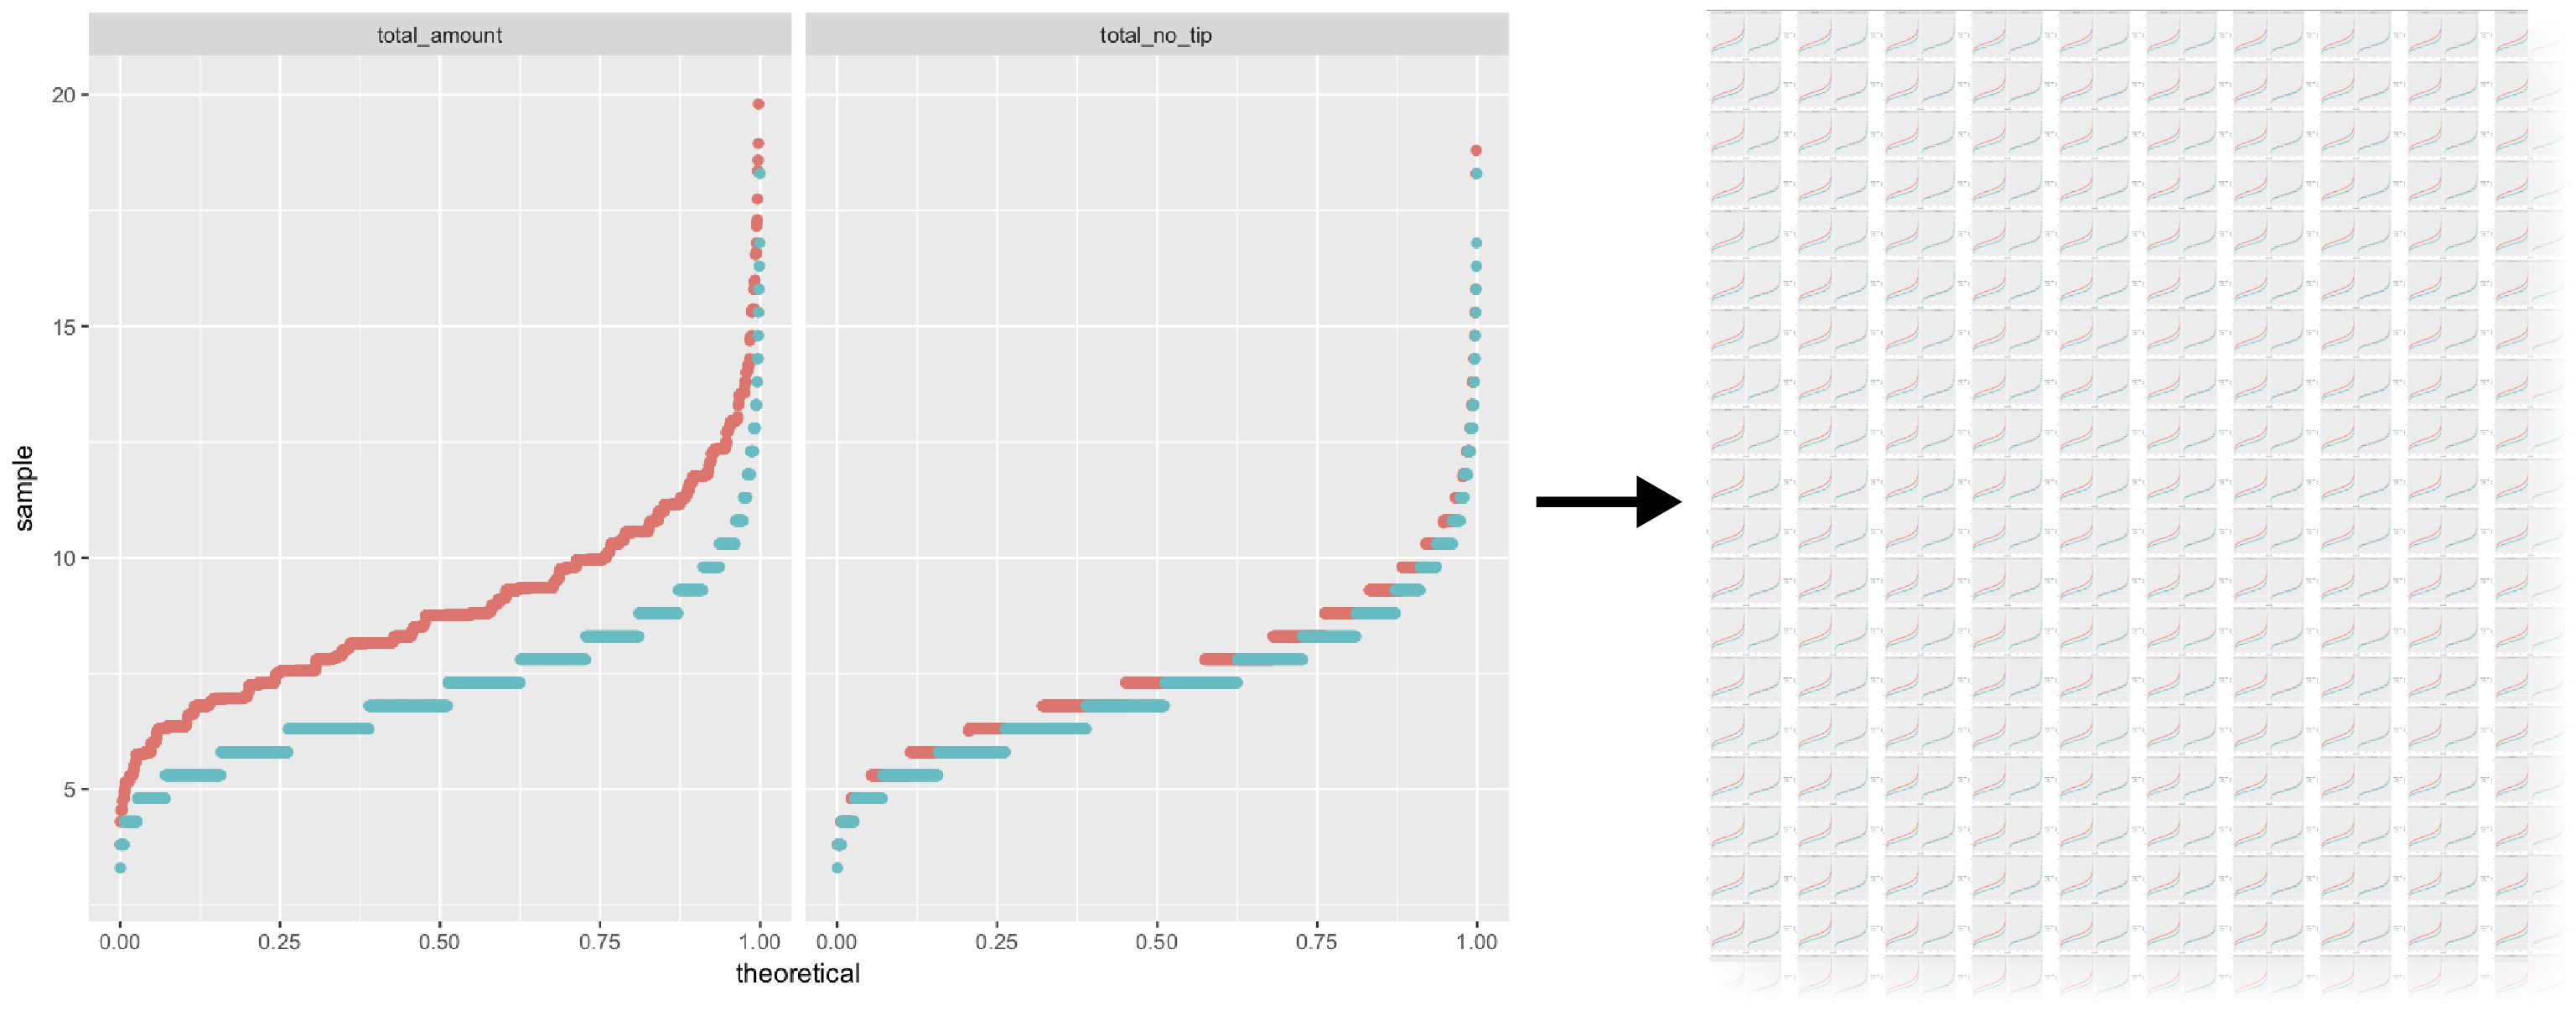
Visualiser de grandes données avec Trelliscope en R

Ryan Hafen
Author, TrelliscopeJS
Découpage en facettes avec TrelliscopeJS
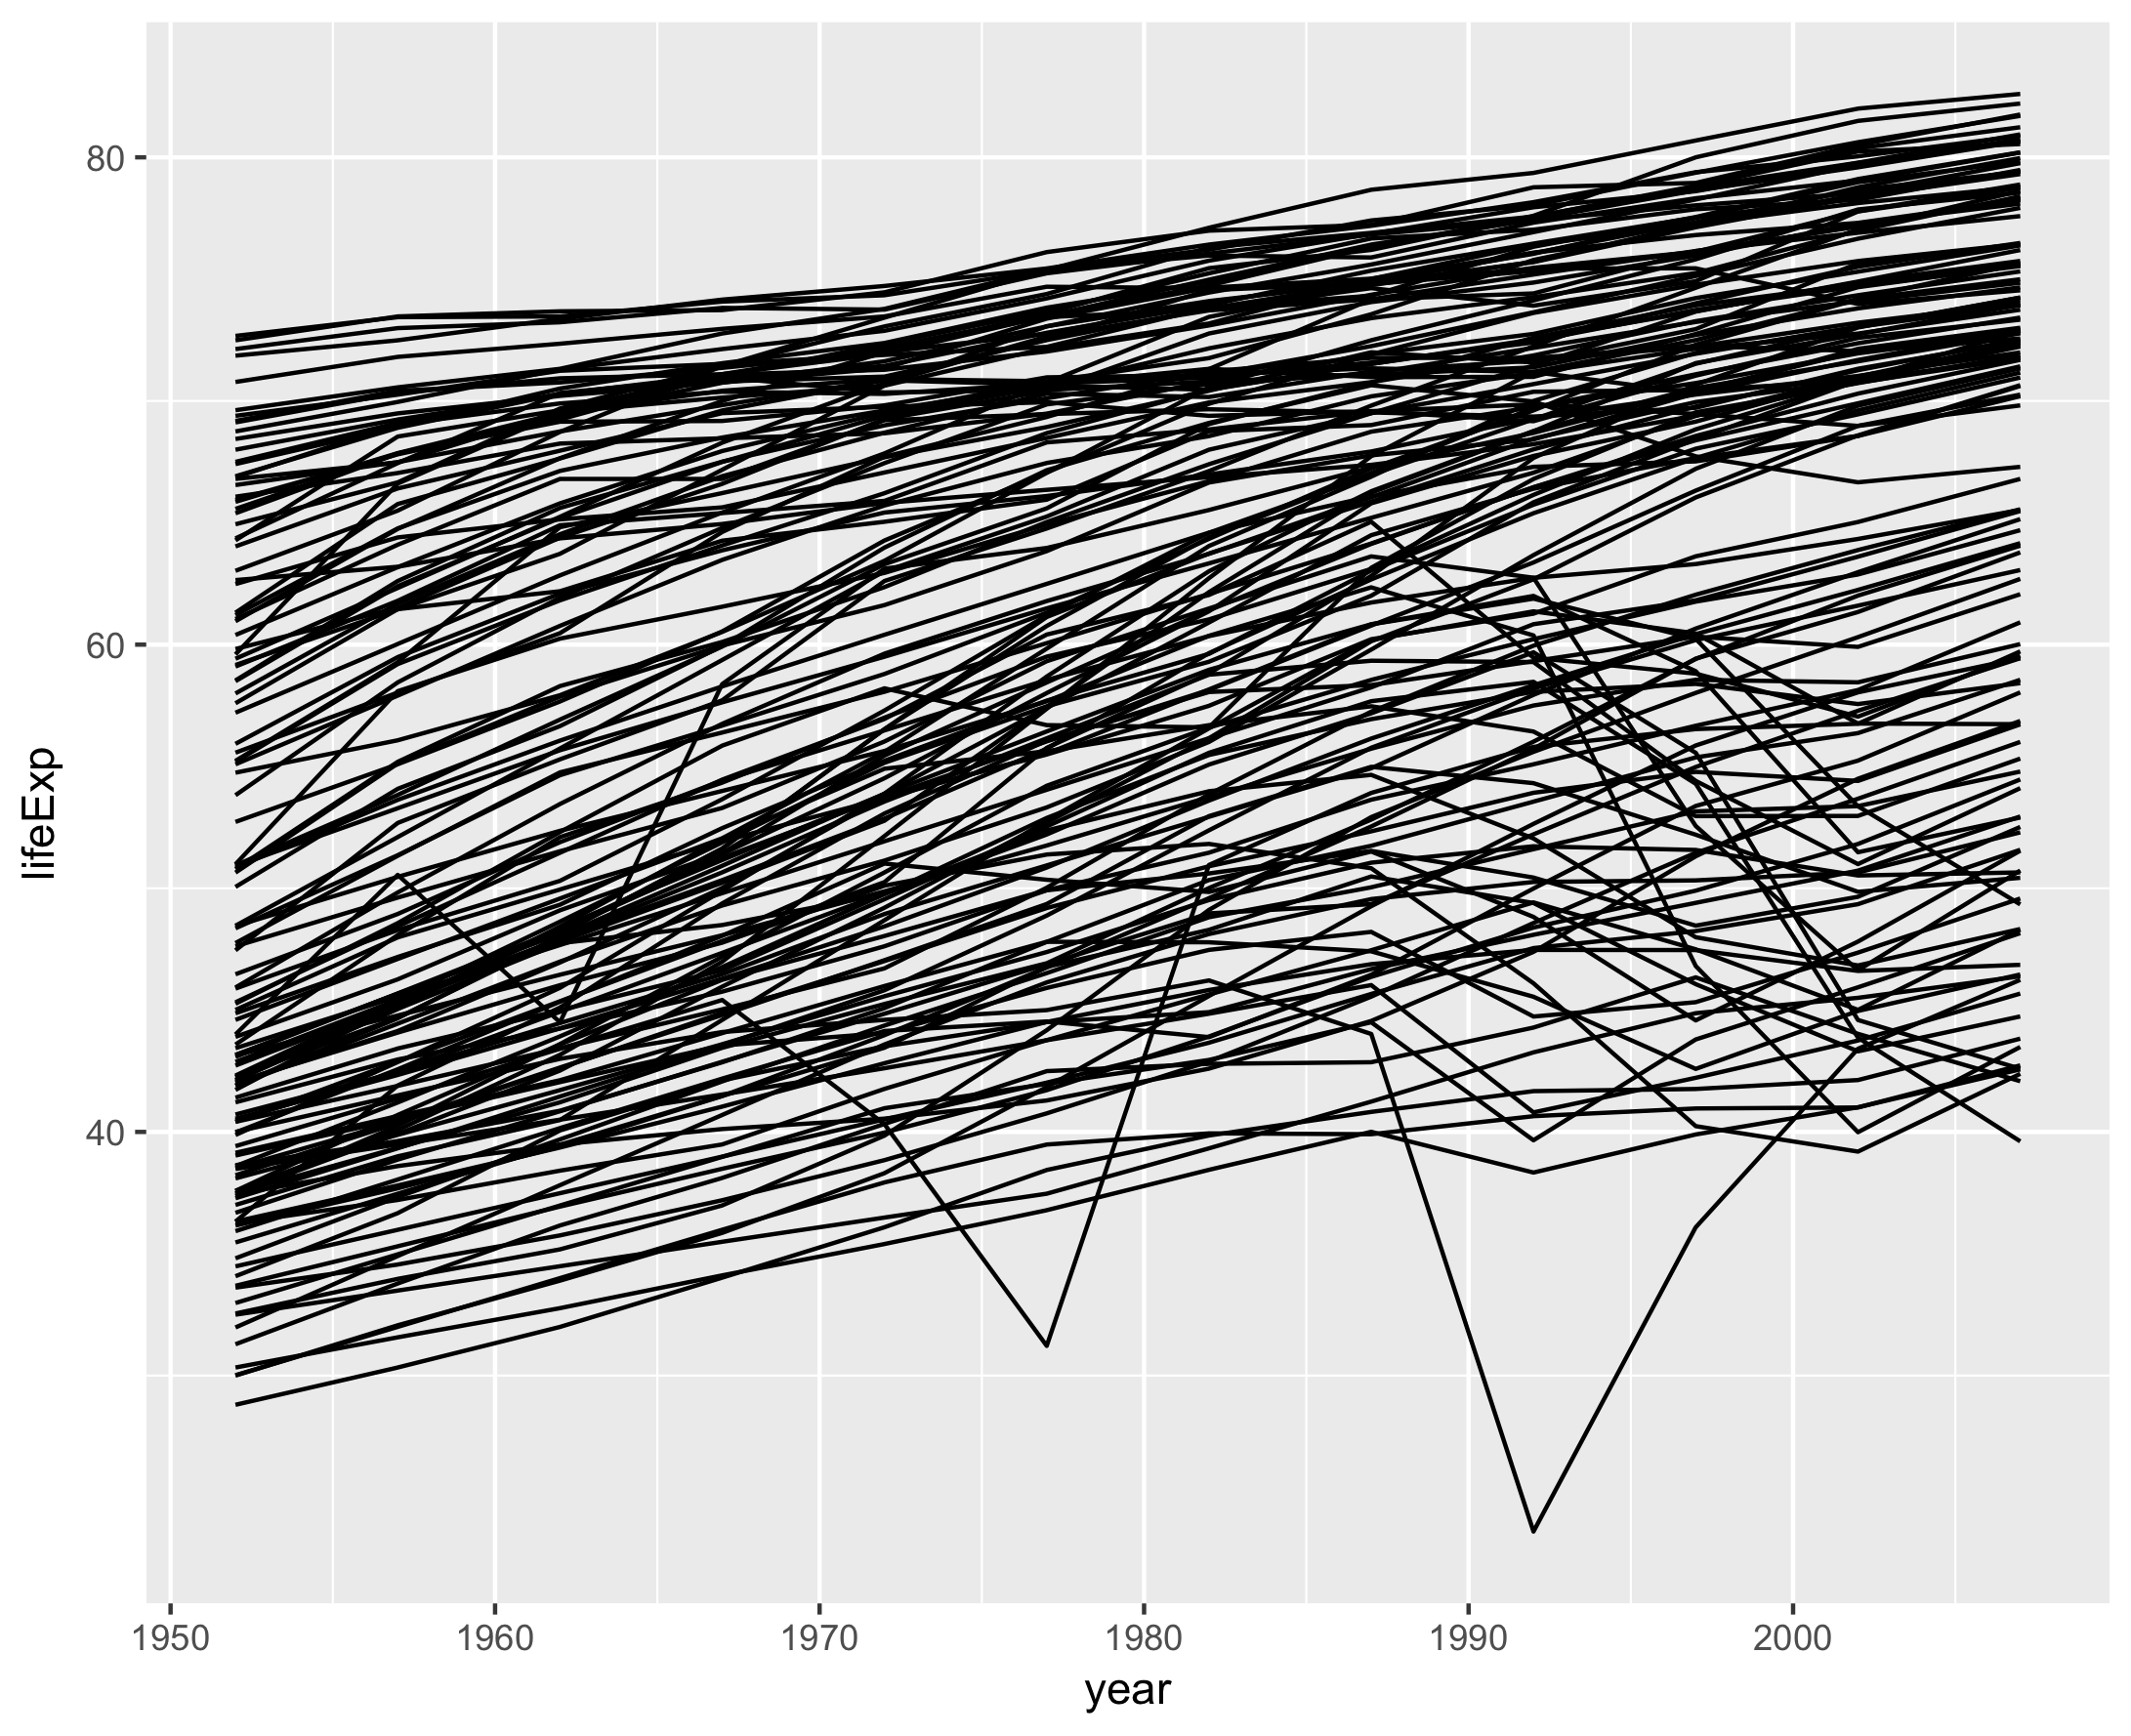
Espérance de vie dans le temps par pays
ggplot(gapminder, aes(year, lifeExp, group = country)) +
  geom_line()
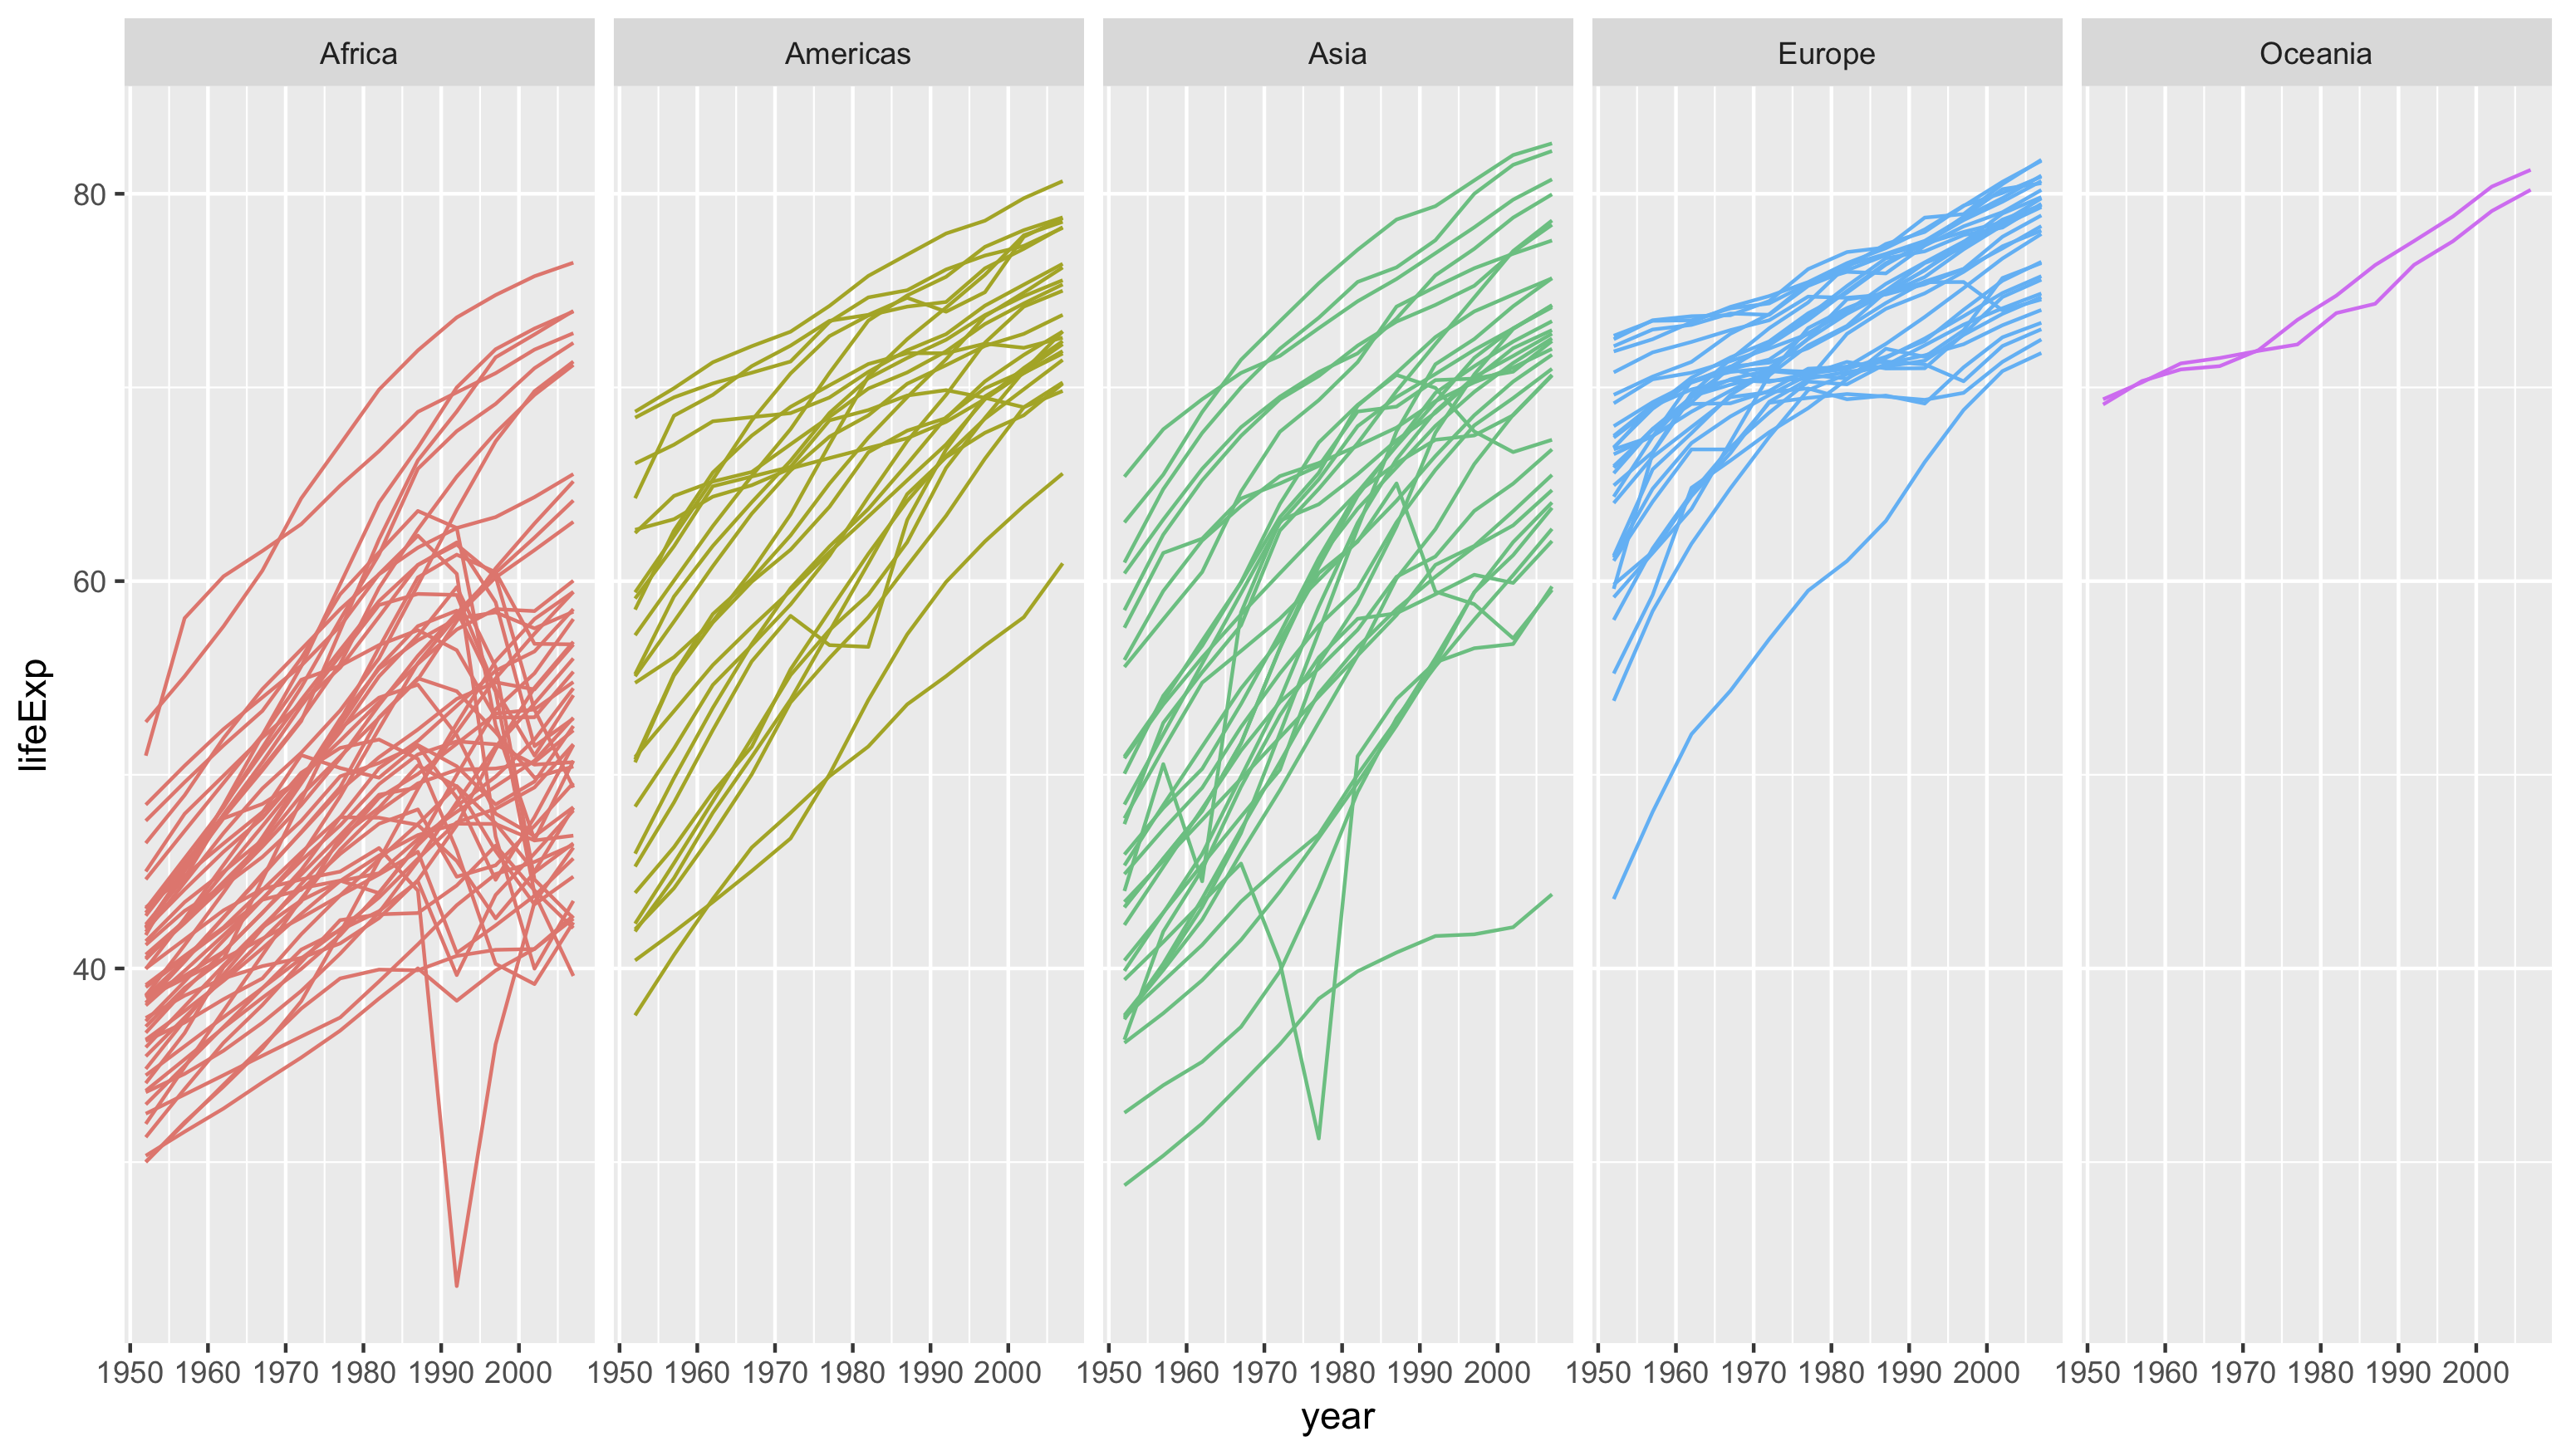
Découpage par continent
ggplot(gapminder, aes(year, lifeExp, group = country, color = continent)) +
  geom_line() +
  facet_wrap(~ continent, nrow = 1) +
  guides(color = FALSE)
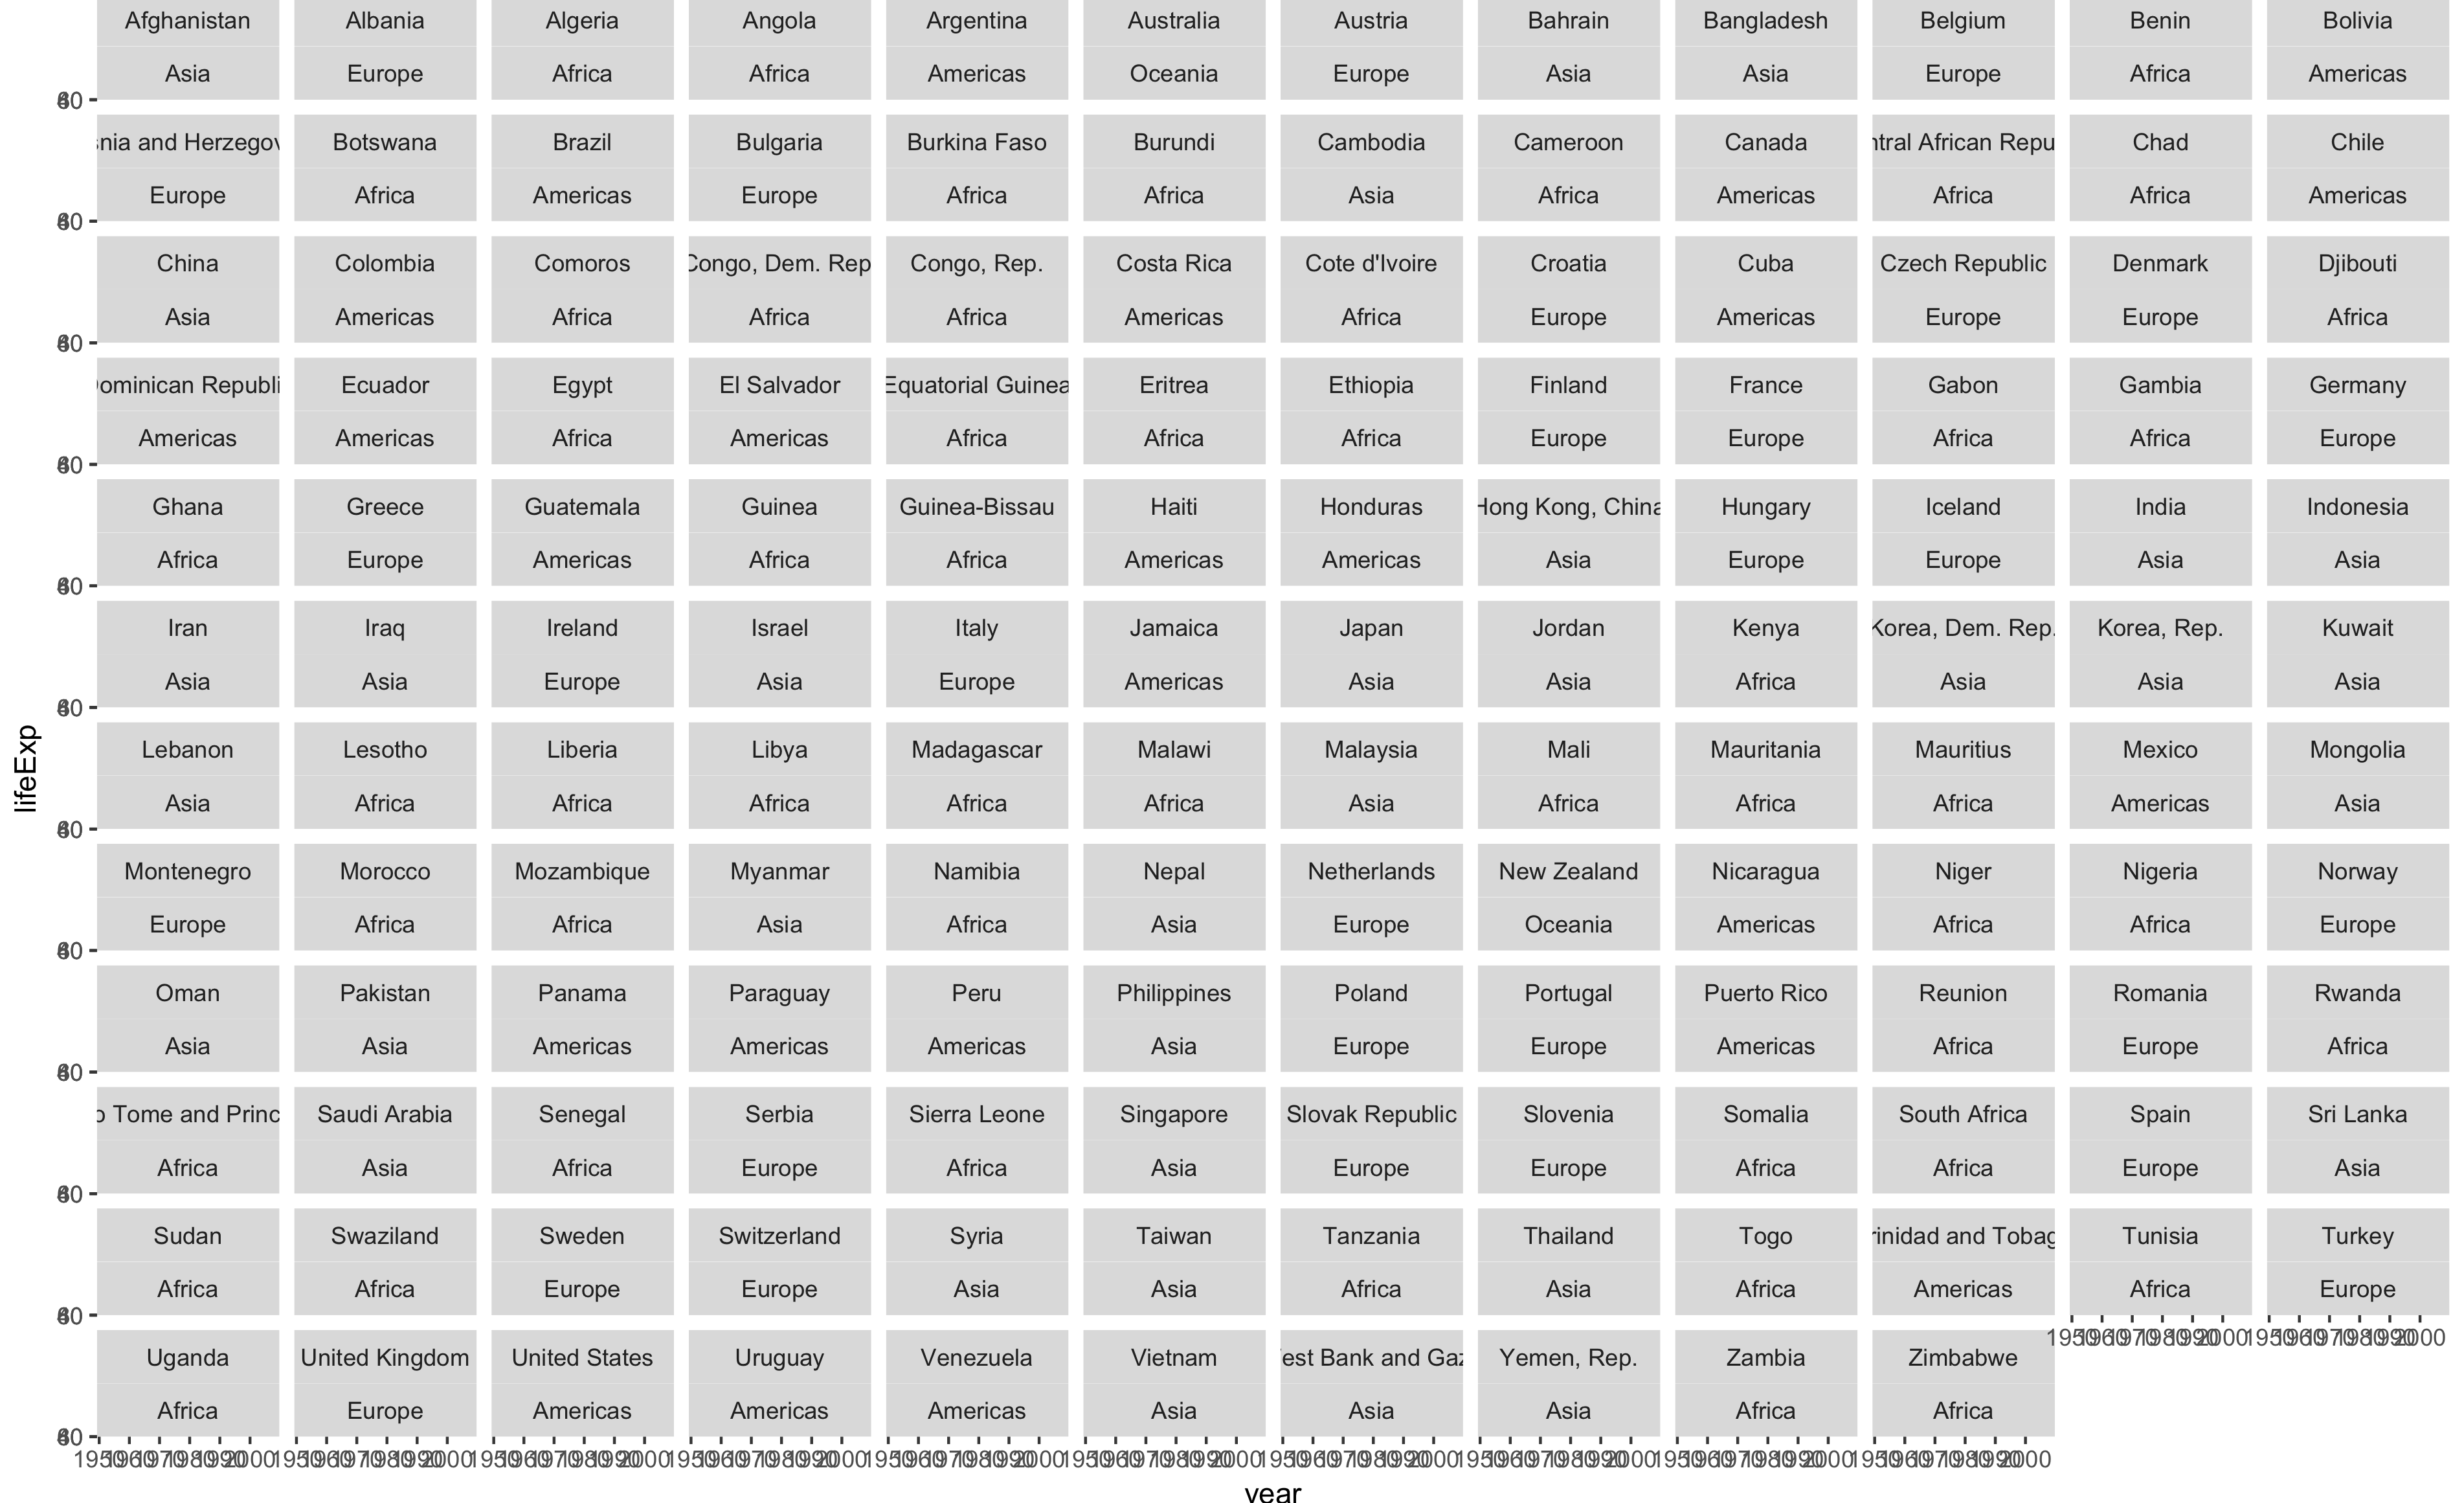
Découpage par pays
ggplot(gapminder, aes(year, lifeExp)) +
  geom_line() +
  facet_wrap(~ country + continent)