Fonctions avancées pour améliorer votre graphique

Études de cas : créer des applications Web avec Shiny en R

Dean Attali

Shiny Consultant

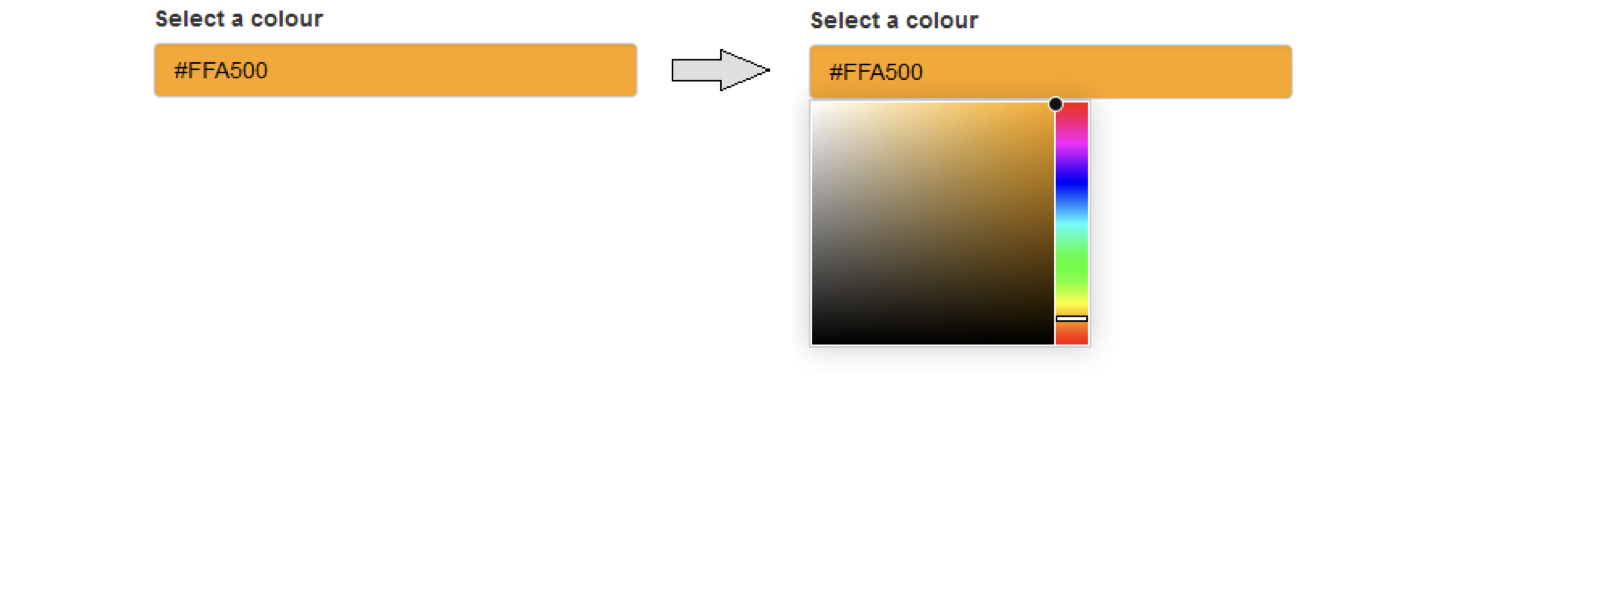
Entrée de couleur

library(colourpicker)

colourInput("col", "Sélectionnez une couleur", value = "orange")
chapter2_4_advanced_features_to_improve_your_plot.006.png

Études de cas : créer des applications Web avec Shiny en R

Les sorties acceptent des arguments

plotOutput(outputId, width = "100%", height = "400px",
           click = NULL, dblclick = NULL, hover = NULL,
           hoverDelay = NULL, hoverDelayType = NULL, 
           brush = NULL, clickId = NULL, hoverId = NULL,
           inline = FALSE)
Études de cas : créer des applications Web avec Shiny en R

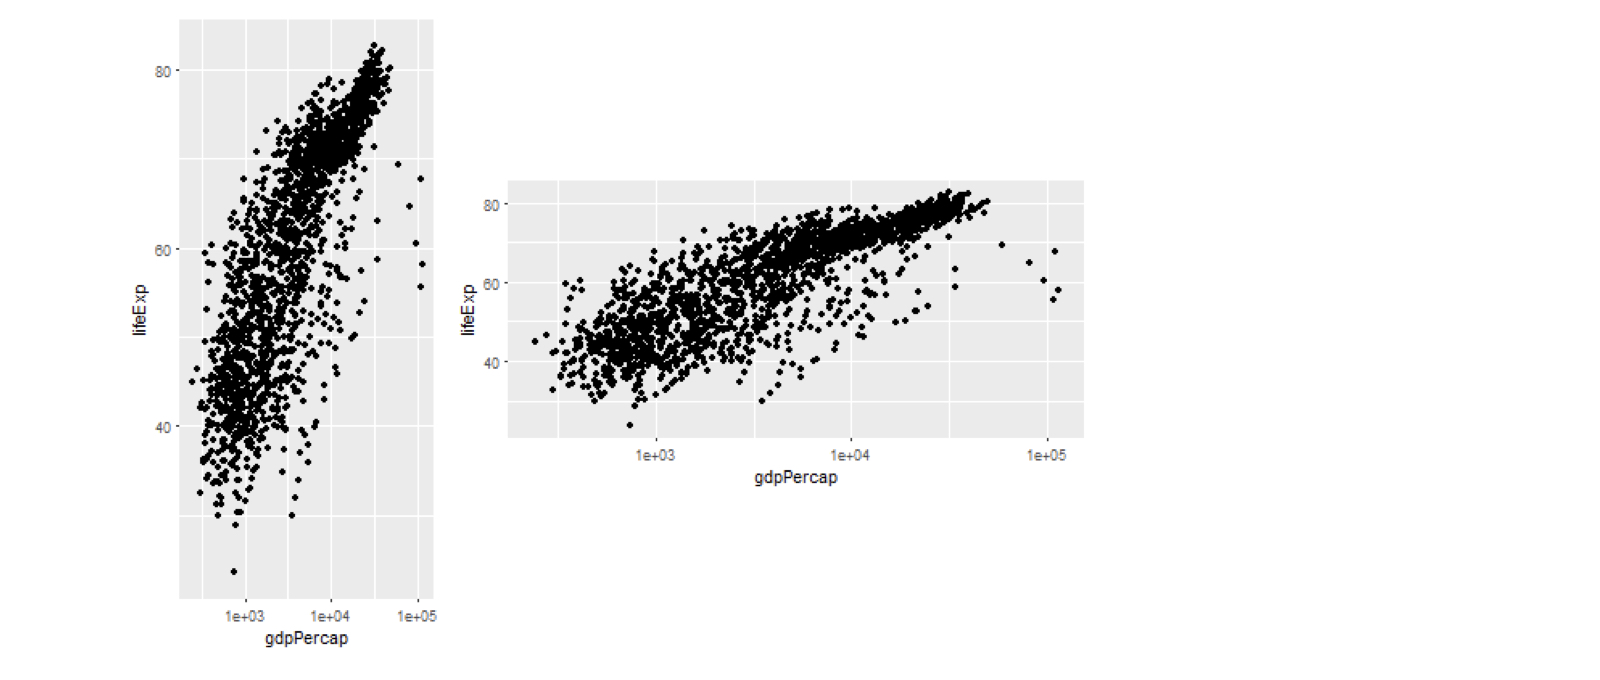
Arguments de sortie pour un graphique

plotOutput("plot1", width = 200, height = 400)
plotOutput("plot2", width = 400, height = 200)
chapter2_4_advanced_features_to_improve_your_plot.008.png

Études de cas : créer des applications Web avec Shiny en R

Graphiques interactifs avec plotly

  • Plusieurs forfaits pour des graphiques interactifs
  • plotly est un choix populaire
  • ggplotly() :
    • tracé ggplot2 ⇒ interactif
p <- ggplot(gapminder, 
          aes(gdpPercap, lifeExp)) +
     geom_point() +
     scale_x_log10()

library(plotly)
ggplotly(p)

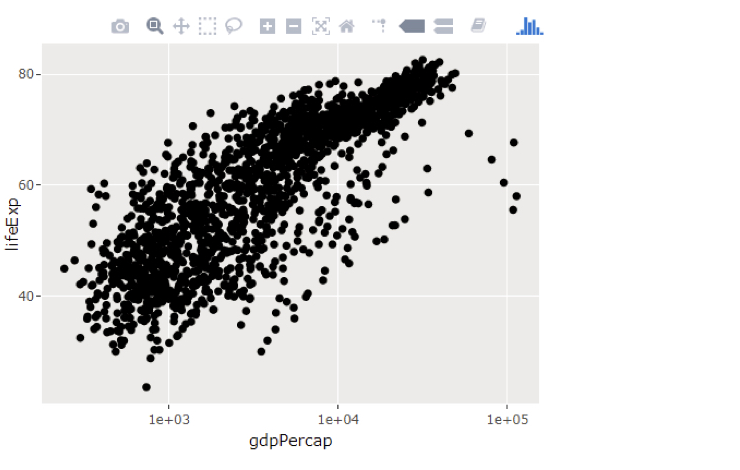
Graphique interactif produit avec plotly

Études de cas : créer des applications Web avec Shiny en R

Graphiques interactifs avec plotly

  • Plusieurs forfaits pour des graphiques interactifs
  • plotly est un choix populaire
  • ggplotly() :
    • tracé ggplot2 ⇒ interactif
p <- ggplot(gapminder, 
          aes(gdpPercap, lifeExp)) +
     geom_point() +
     scale_x_log10()

library(plotly)
ggplotly(p)

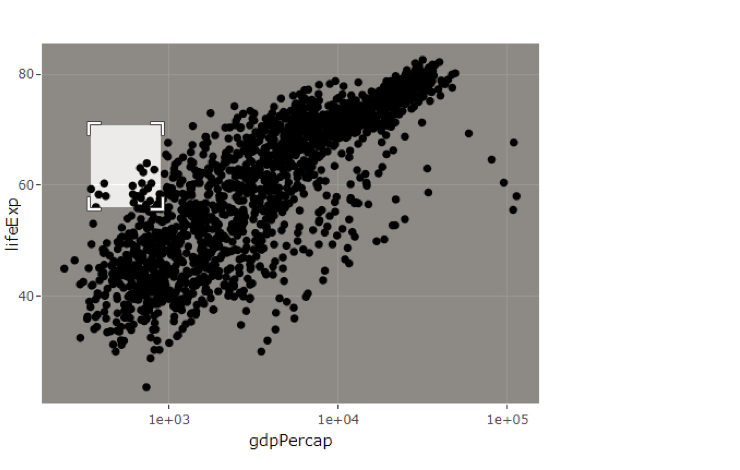
Graphique interactif produit avec plotly

Études de cas : créer des applications Web avec Shiny en R

Graphiques interactifs avec plotly

  • Plusieurs forfaits pour des graphiques interactifs
  • plotly est un choix populaire
  • ggplotly() :
    • tracé ggplot2 ⇒ interactif
p <- ggplot(gapminder, 
          aes(gdpPercap, lifeExp)) +
     geom_point() +
     scale_x_log10()

library(plotly)
ggplotly(p)

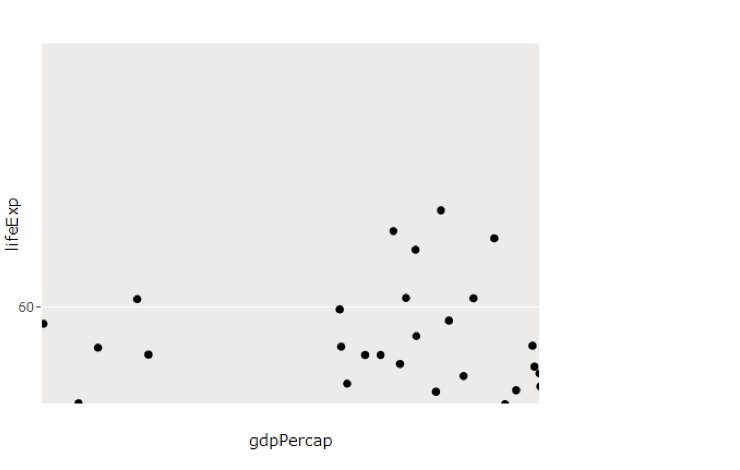
Graphique interactif produit avec plotly

Études de cas : créer des applications Web avec Shiny en R

Graphiques interactifs avec plotly

  • Plusieurs forfaits pour des graphiques interactifs
  • plotly est un choix populaire
  • ggplotly() :
    • tracé ggplot2 ⇒ interactif
p <- ggplot(gapminder, 
          aes(gdpPercap, lifeExp)) +
     geom_point() +
     scale_x_log10()

library(plotly)
ggplotly(p)

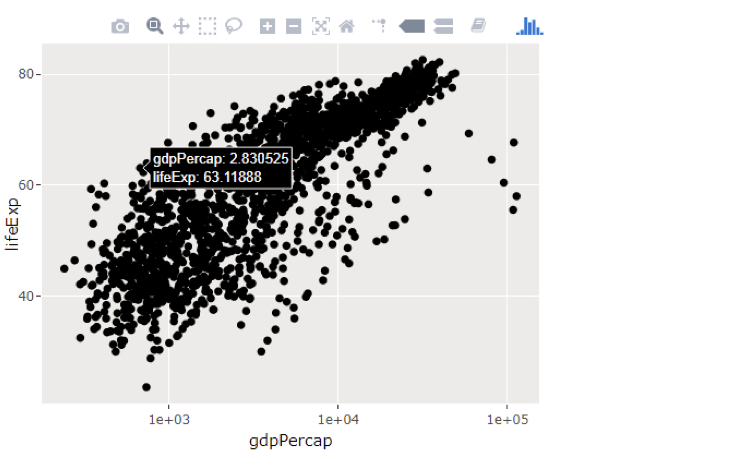
Graphique interactif produit avec plotly

Études de cas : créer des applications Web avec Shiny en R

plotly dans Shiny

  • Incorrect
plotOutput("plot")
renderPlot(ggplotly(p))
  • Correct
plotlyOutput("plot")
renderPlotly(ggplotly(p))
Études de cas : créer des applications Web avec Shiny en R

Passons à la pratique !

Études de cas : créer des applications Web avec Shiny en R

Preparing Video For Download...