Ajouter des annotations

Visualisation de données interactive avec Bokeh

George Boorman

Core Curriculum Manager, DataCamp

Annotation de boîte
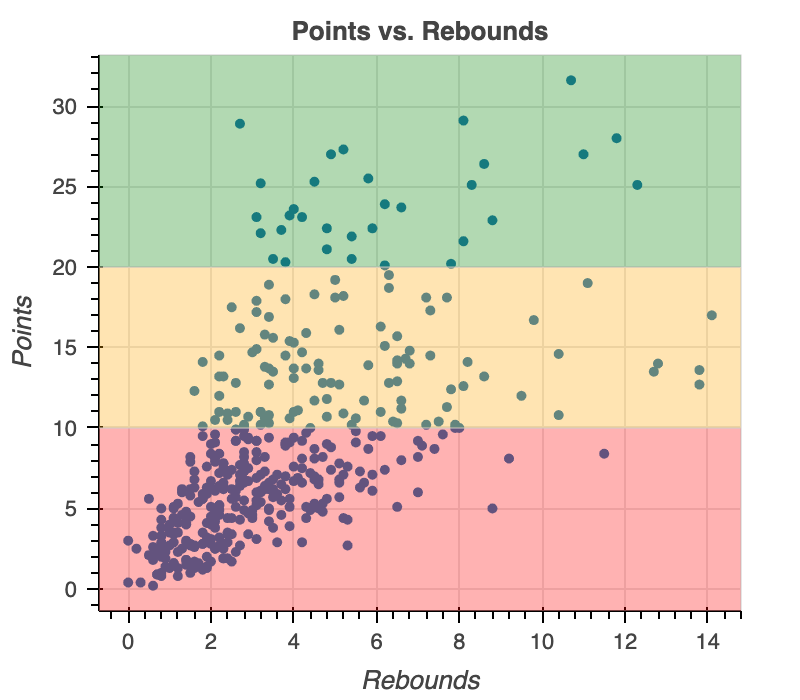
annotation de boîte

Visualisation de données interactive avec Bokeh

Ajouter des annotations de boîte

from bokeh.models import BoxAnnotation
fig = figure(x_axis_label="Rebounds", y_axis_label="Points", title="Points vs. Rebounds")
fig.circle(x="rebounds", y="points", source=source)

low_box = BoxAnnotation(top=10, fill_color="red", fill_alpha=0.3)
mid_box = BoxAnnotation(bottom=10, top=20, fill_color="orange", fill_alpha=0.3)
high_box = BoxAnnotation(bottom=20, fill_color="green", fill_alpha=0.3)
fig.add_layout(low_box) fig.add_layout(mid_box) fig.add_layout(high_box)
fig.title.align = "center" output_file("color_annotated_plot.html") show(fig)
Visualisation de données interactive avec Bokeh

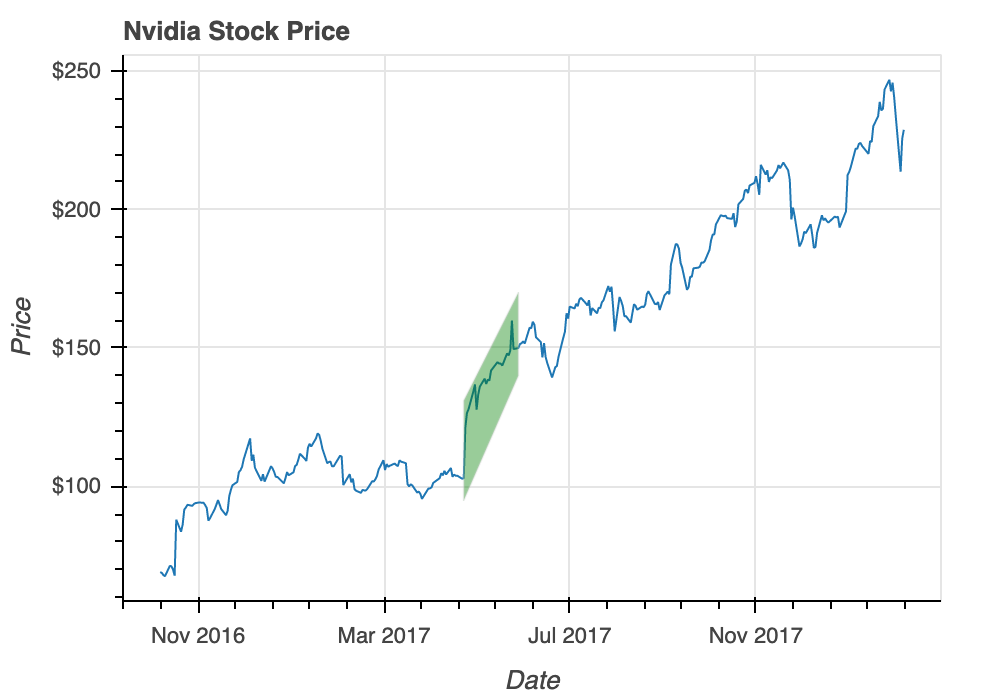
Annotation polygonale

tracé avec polygone

Visualisation de données interactive avec Bokeh

Ajouter une annotation polygonale

import datetime as dt
from bokeh.models import PolyAnnotation
fig = figure(title="Nvidia Stock Price", x_axis_label="Date", y_axis_label="Price")
fig.line(x="date", y="close", source=source)
fig.xaxis[0].formatter = DatetimeTickFormatter(months="%b %Y")
fig.yaxis[0].formatter = NumeralTickFormatter(format="$0")

start_date = dt.datetime(2017, 5, 9) end_date = dt.datetime(2017, 6, 12)
start_float = start_date.timestamp() * 1000 end_float = end_date.timestamp() * 1000
start_data = nvidia.loc[nvidia['date'] == start_date]['close'].values[0] end_data = nvidia.loc[nvidia['date'] == end_date]['close'].values[0]
polygon = PolyAnnotation(fill_color="green", fill_alpha=0.4,
xs = [start_float, start_float, end_float, end_float],
ys = [start_data-8, start_data+28, end_data+20, end_data-10])
fig.add_layout(polygon) output_file(filename="nvidia_polygon_annotation.html") show(fig)
Visualisation de données interactive avec Bokeh

Passons à la pratique !

Visualisation de données interactive avec Bokeh

Preparing Video For Download...