Visualiser le score de distance kNN

Introduction à la détection d'anomalies en R

Alastair Rushworth

Data Scientist

Normaliser l'échelle des variables

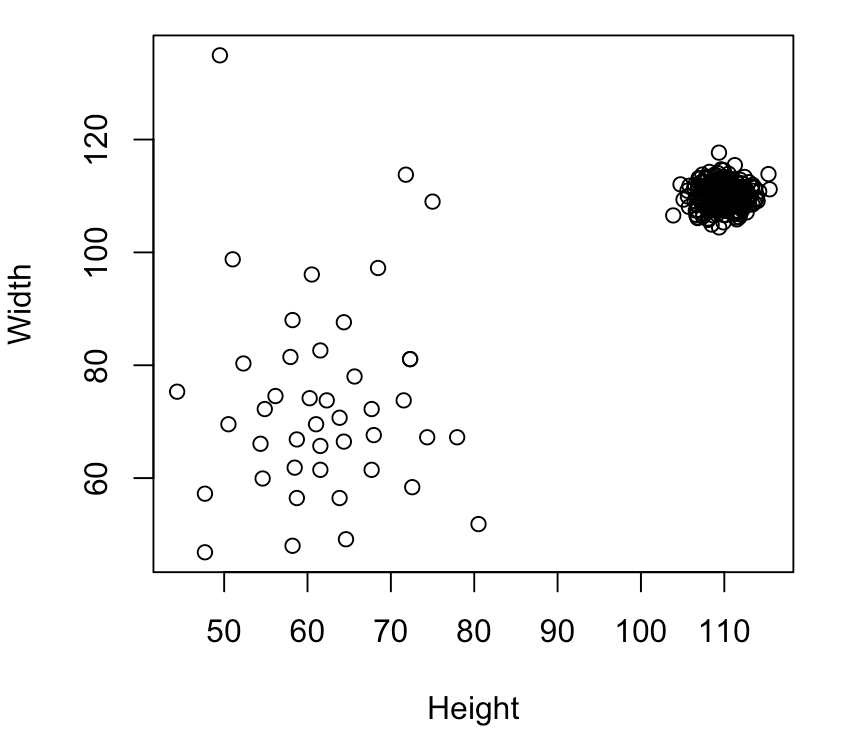
plot(Width ~ Height, data = furniture)
Introduction à la détection d'anomalies en R

Normaliser les variables

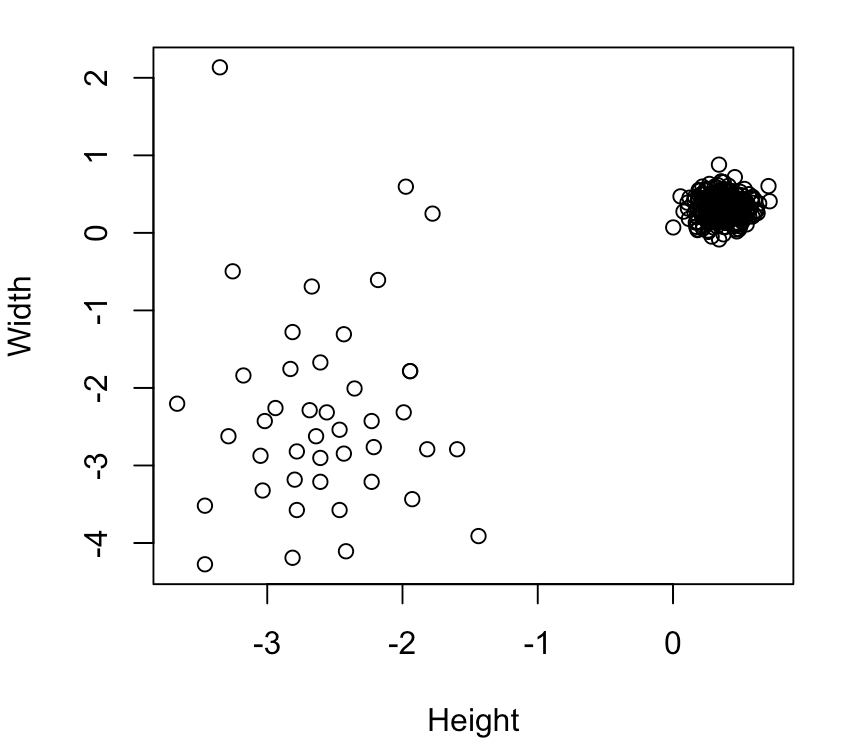
furniture_scaled <- scale(furniture)

plot(Width ~ Height, data = furniture_scaled)
Introduction à la détection d'anomalies en R

Créer et ajouter un score de distance

Matrice des distances

furniture_scaled <- scale(furniture)
furniture_knn    <- get.knn(furniture_scaled, 5)

Calculer et ajouter le score

furniture$score  <- rowMeans(furniture_knn$nn.dist)

head(furniture, 4)
   Height   Width     score
1 58.7179 56.4663 0.4170000
2 54.6154 59.9279 0.3981695
3 58.7179 66.8510 0.2845042
4 63.8462 56.4663 0.4376807
Introduction à la détection d'anomalies en R

Visualiser le score de distance

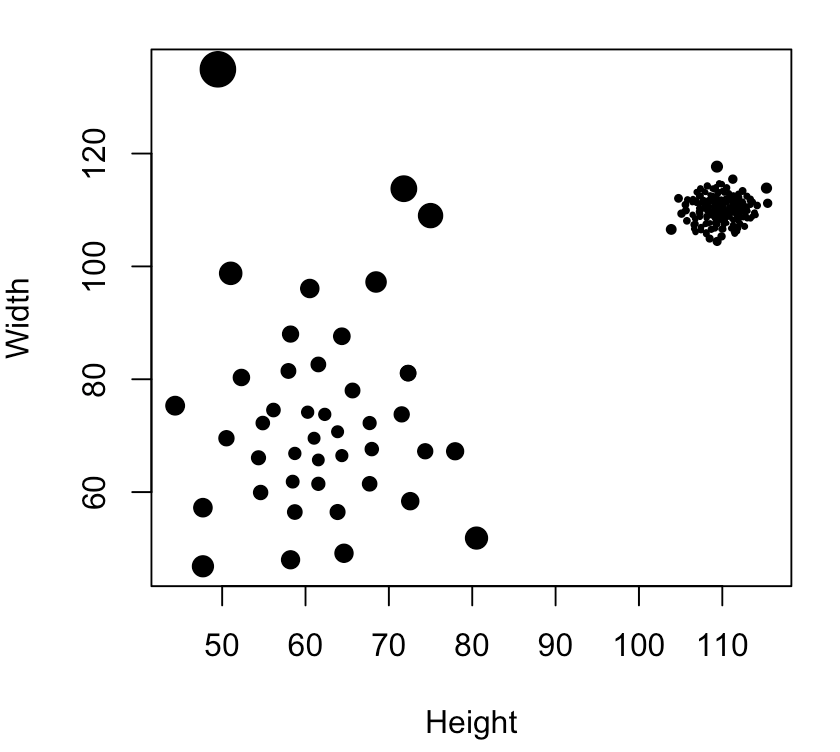
plot(Width ~ Height, cex = sqrt(score), data = furniture, pch = 20)
Introduction à la détection d'anomalies en R

Passons à la pratique !

Introduction à la détection d'anomalies en R

Preparing Video For Download...