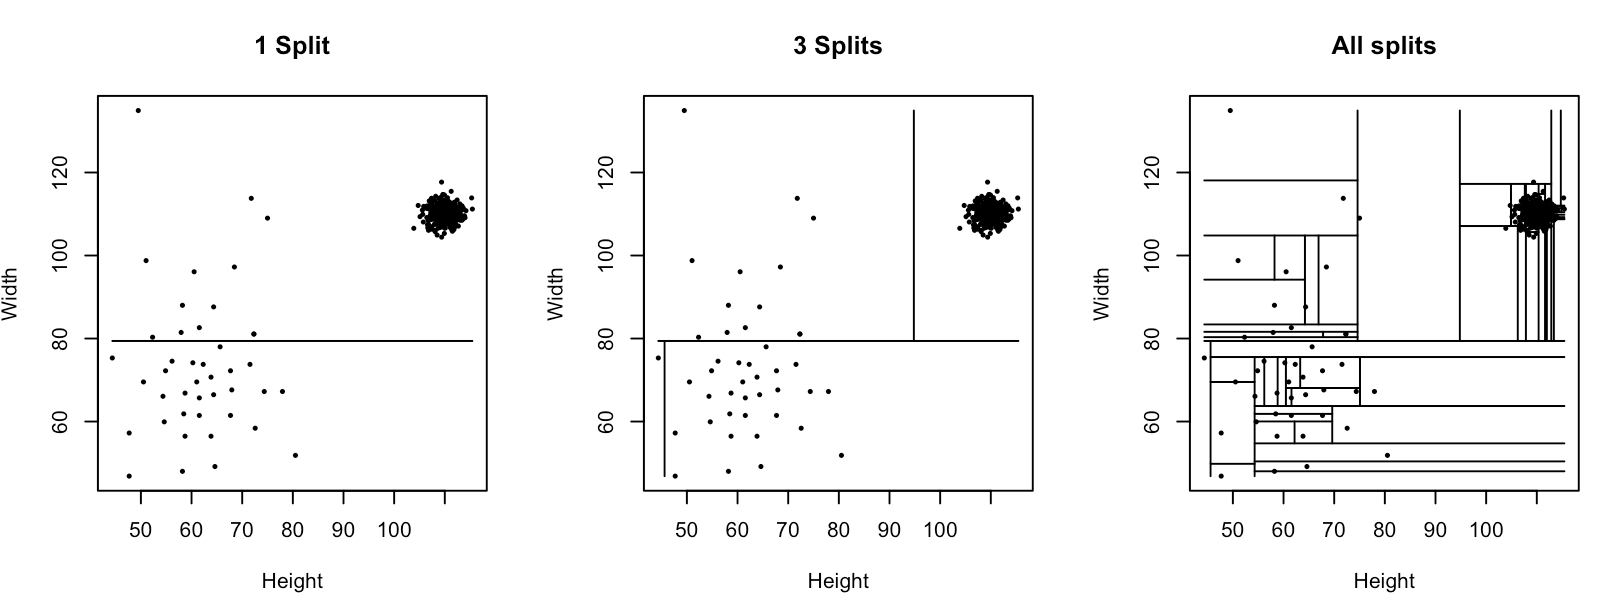
Arbres d'isolation

Introduction à la détection d'anomalies en R

Alastair Rushworth

Data Scientist

Arbre d'isolation

Introduction à la détection d'anomalies en R

Graphiques d'arbre d'isolation

Introduction à la détection d'anomalies en R

Ajuster un arbre d'isolation

library(isofor)

furniture_tree <- iForest(data = furniture, nt = 1)

Paramètres de iForest()

  • data - trame de données
  • nt - nombre d'arbres d'isolation à entraîner


Téléchargement du paquet : https://github.com/Zelazny7/isofor

Introduction à la détection d'anomalies en R

Générer un score d'isolation

furniture_score <- predict(furniture_tree, newdata = furniture)

Paramètres de predict()

  • object - un modèle iForest ajusté
  • newdata - données à scorer
Introduction à la détection d'anomalies en R

Interpréter le score d'isolation

furniture_score[1:10]
[1] 0.5820092 0.5820092 0.5439338 0.5820092 0.5439338 
[6] 0.5820092 0.7129862 0.5363547 0.5363547 0.5363547

Longueur de parcours normalisée

  • Scores entre 0 et 1
  • Un score proche de 1 indique une anomalie (parcours court)
Introduction à la détection d'anomalies en R

Passons à la pratique !

Introduction à la détection d'anomalies en R

Preparing Video For Download...