Visualisation de données interactive intermédiaire avec plotly en R
Adam Loy
Statistician, Carleton College
Sélection transitoire
les cas choisis précédemment sont oubliés

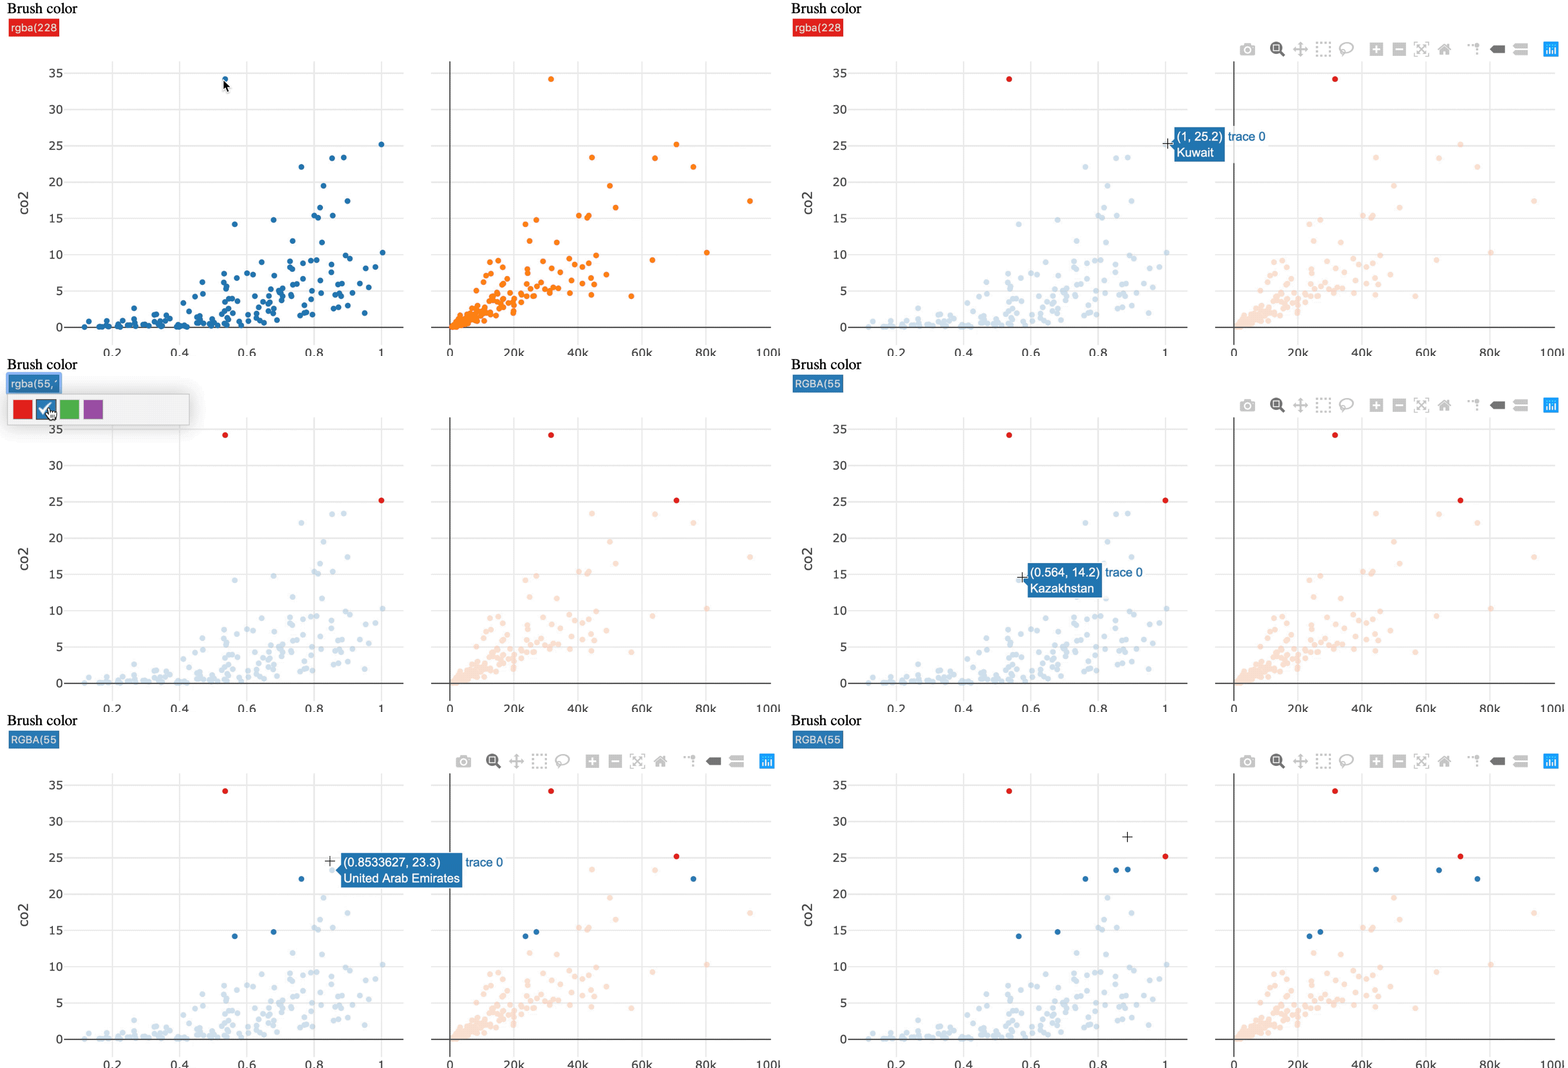
Sélection persistante
les cas sélectionnés s'accumulent


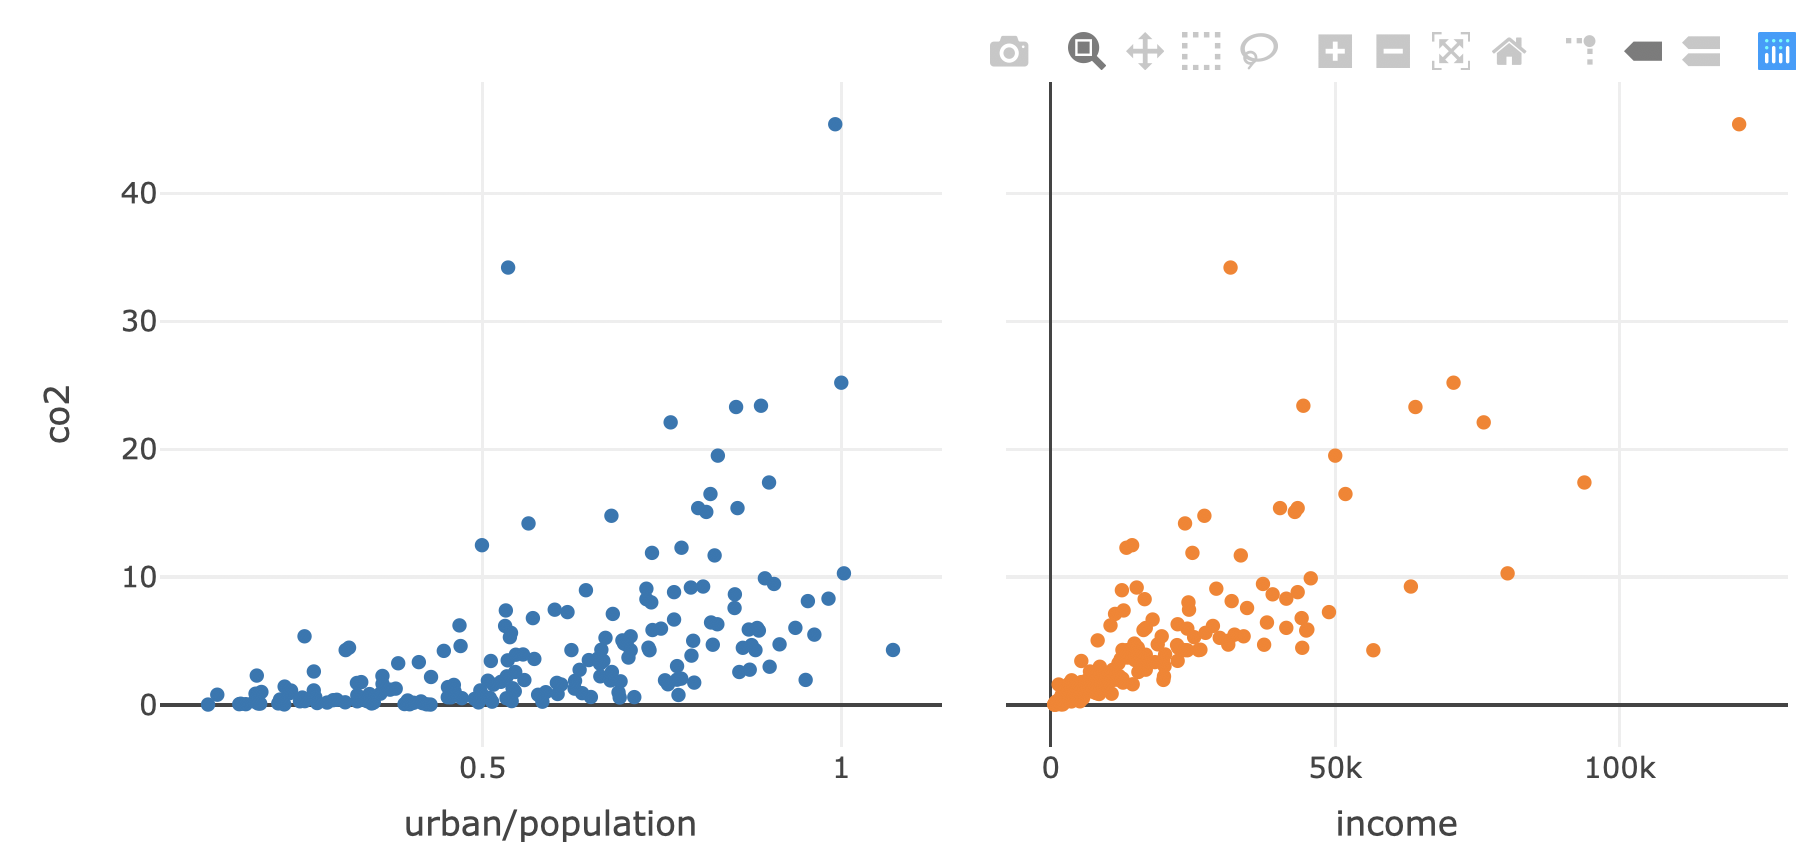
shared_data <- world2014 %>% SharedData$new()
p1 <- shared_data %>%
plot_ly(x=~urban/population, y = ~co2, text = ~country) %>%
add_markers()
p2 <- shared_data %>%
plot_ly(x=~income, y = ~co2, text = ~country) %>%
add_markers()
subplot(p1, p2, titleX = TRUE, shareY = TRUE) %>%
hide_legend()
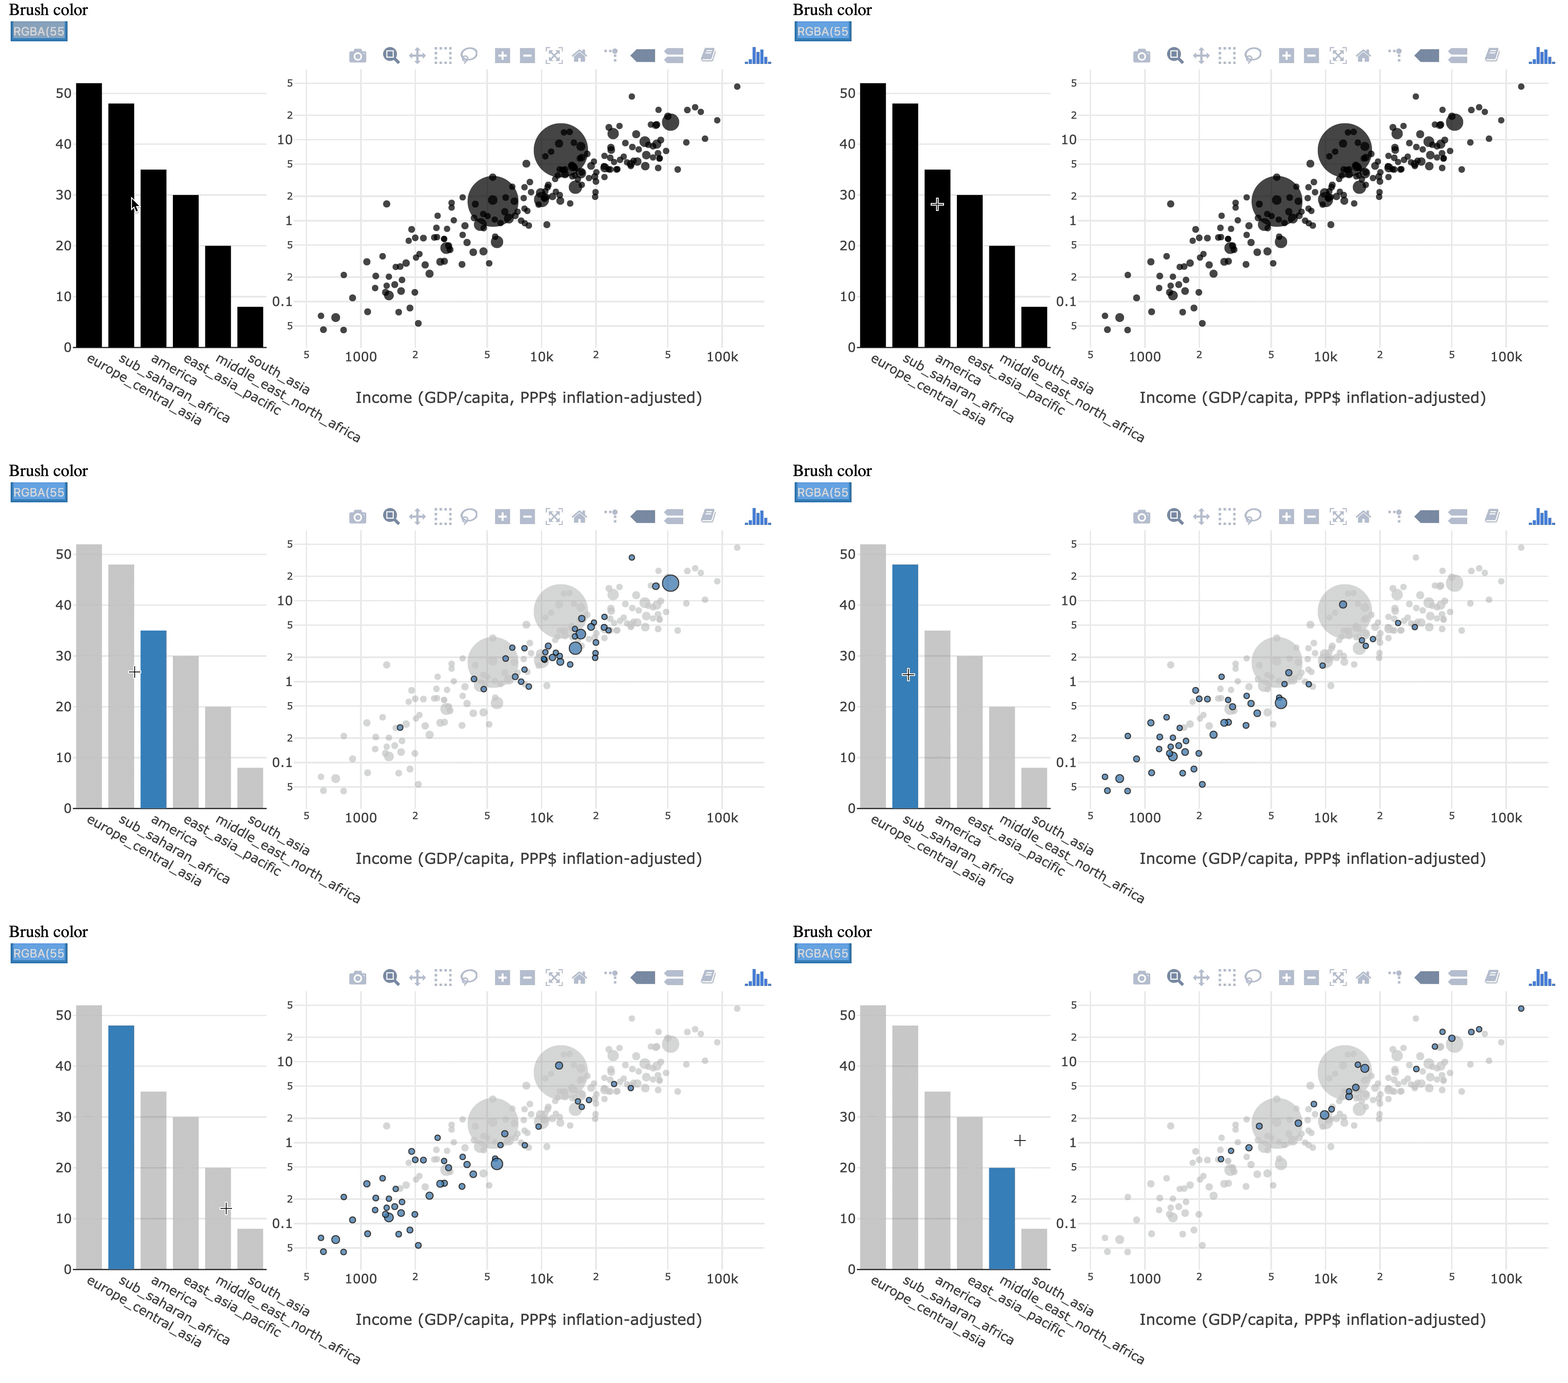
Activer la sélection persistante avec highlight()
subplot(p1, p2, titleX = TRUE, shareY = TRUE) %>%
hide_legend() %>%
highlight(persistent = TRUE)
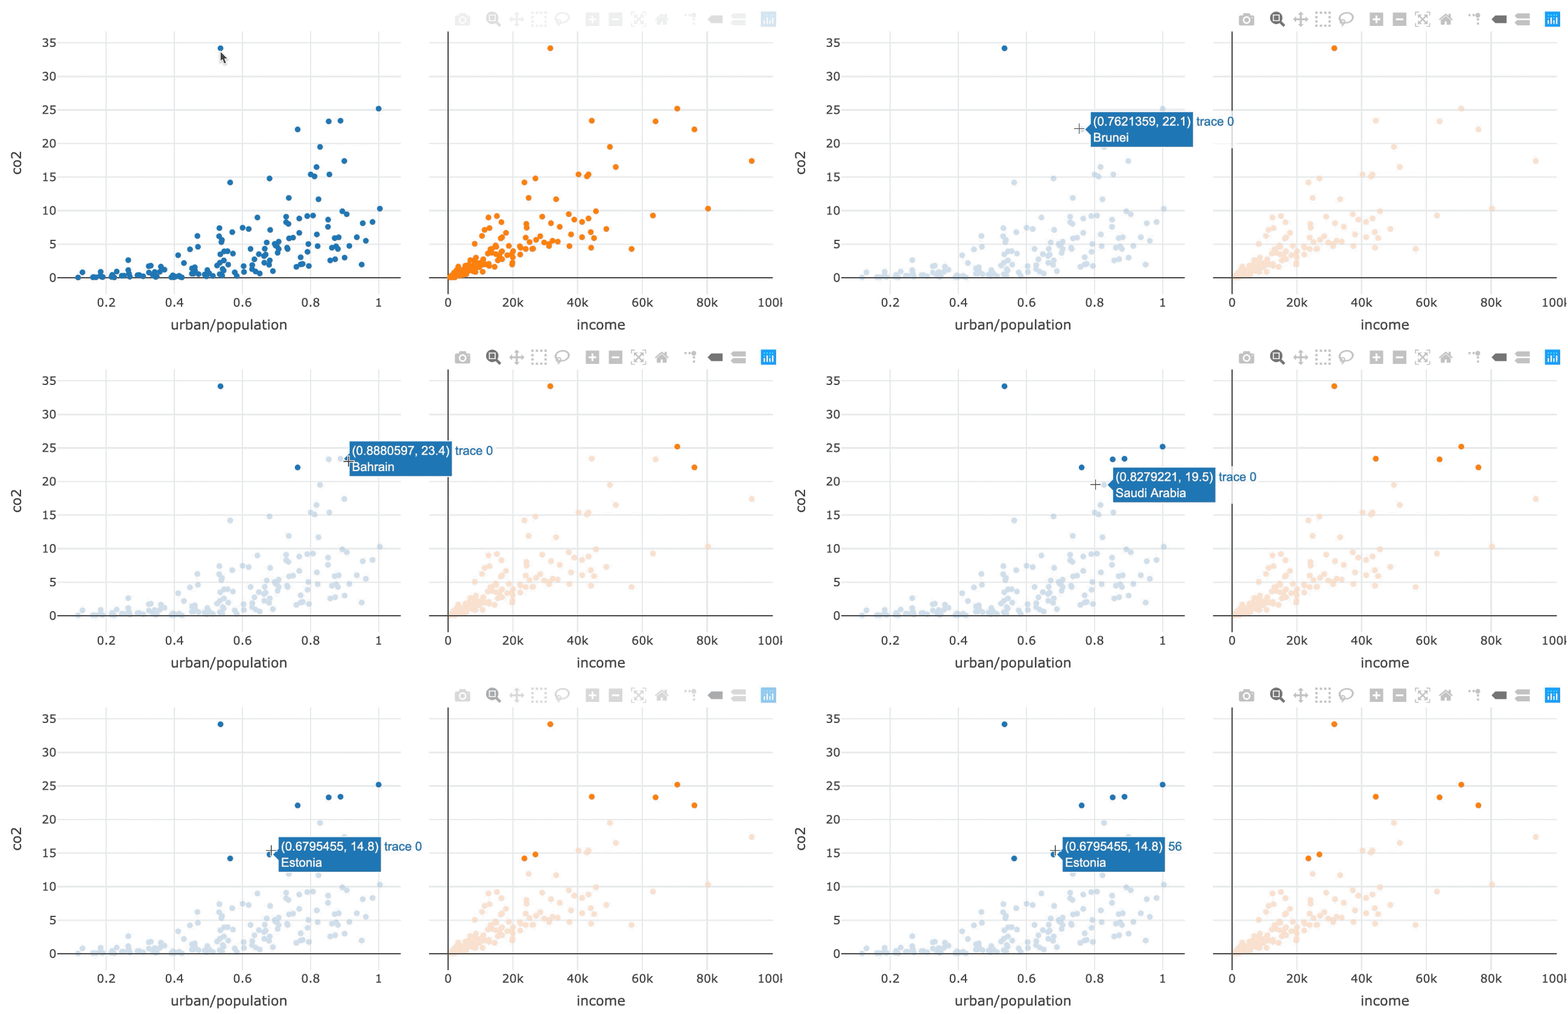

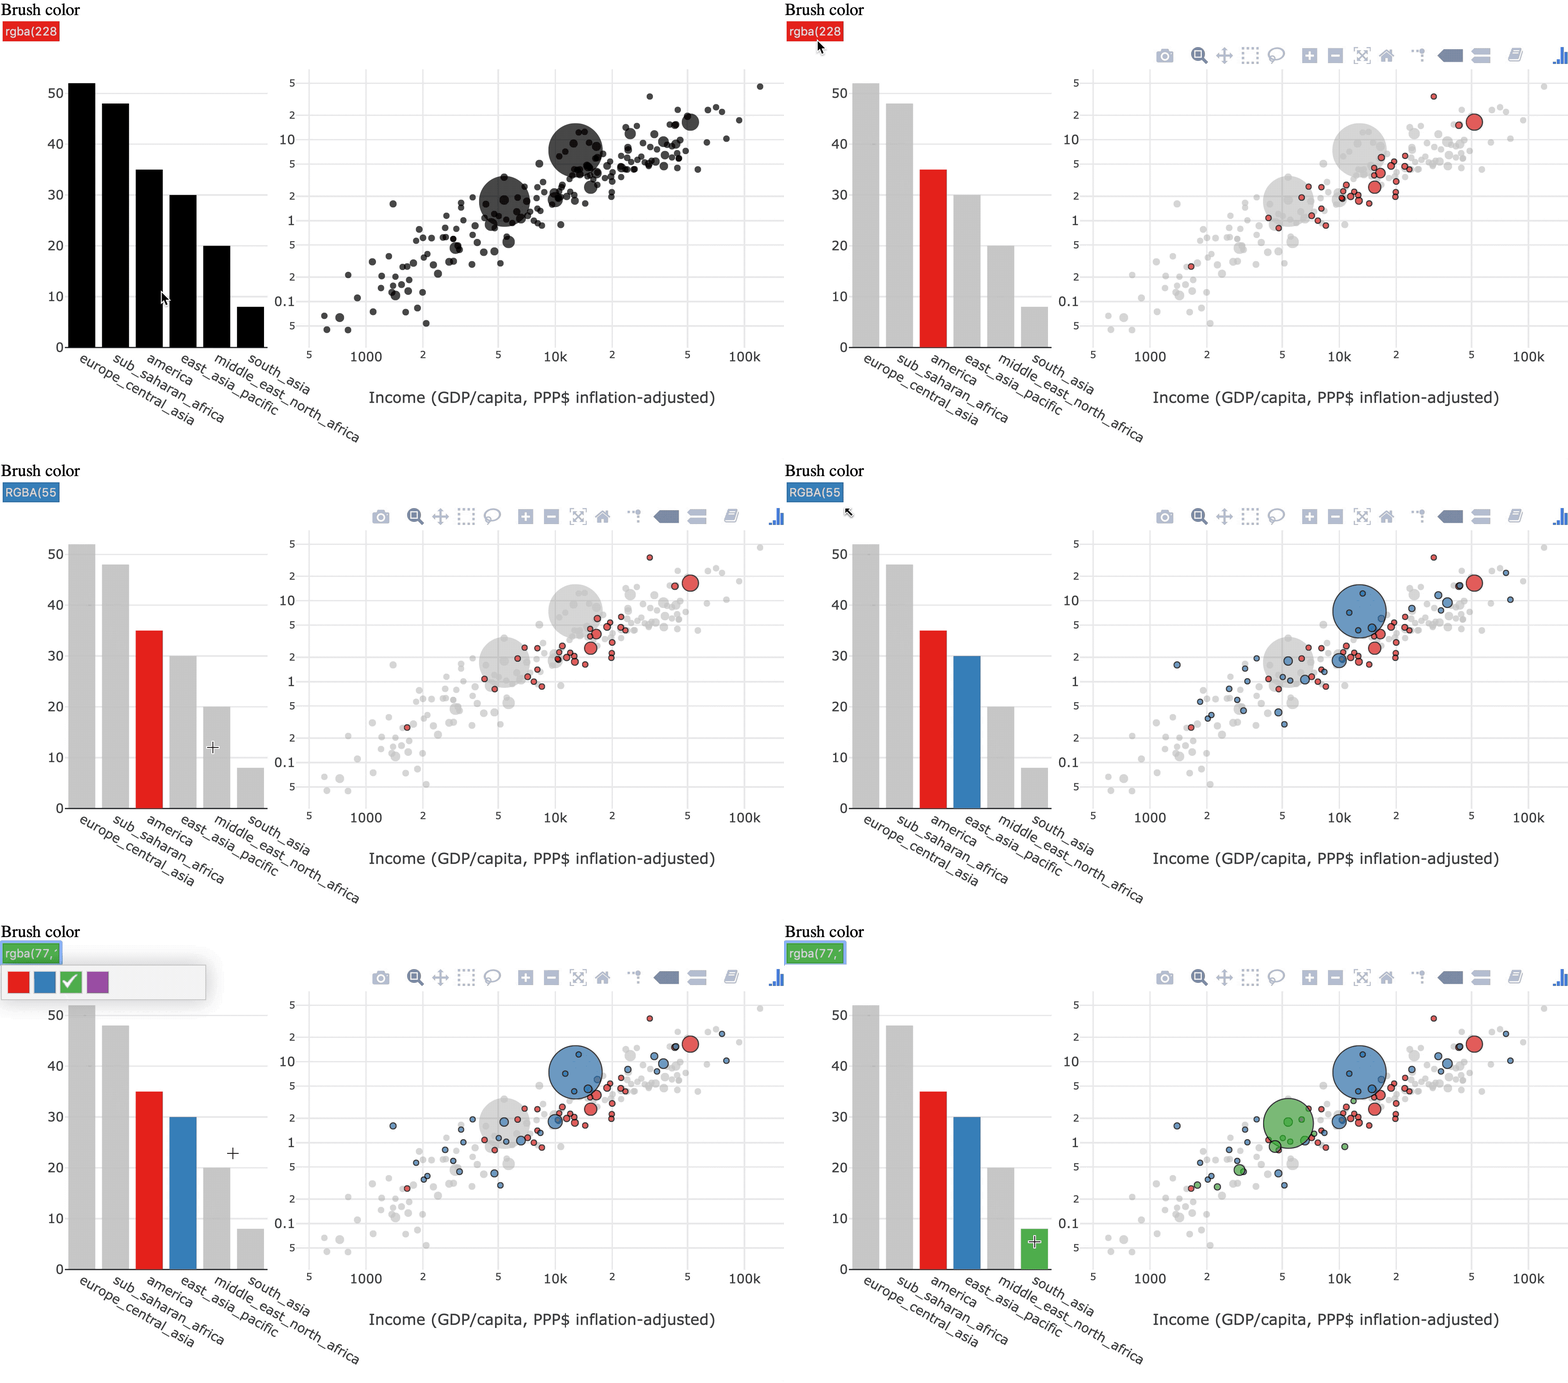
Ajouter dynamic = TRUE pour activer un sélecteur de couleur
subplot(p1, p2, titleX = TRUE, shareY = TRUE) %>%
hide_legend() %>%
highlight(persistent = TRUE, dynamic = TRUE)
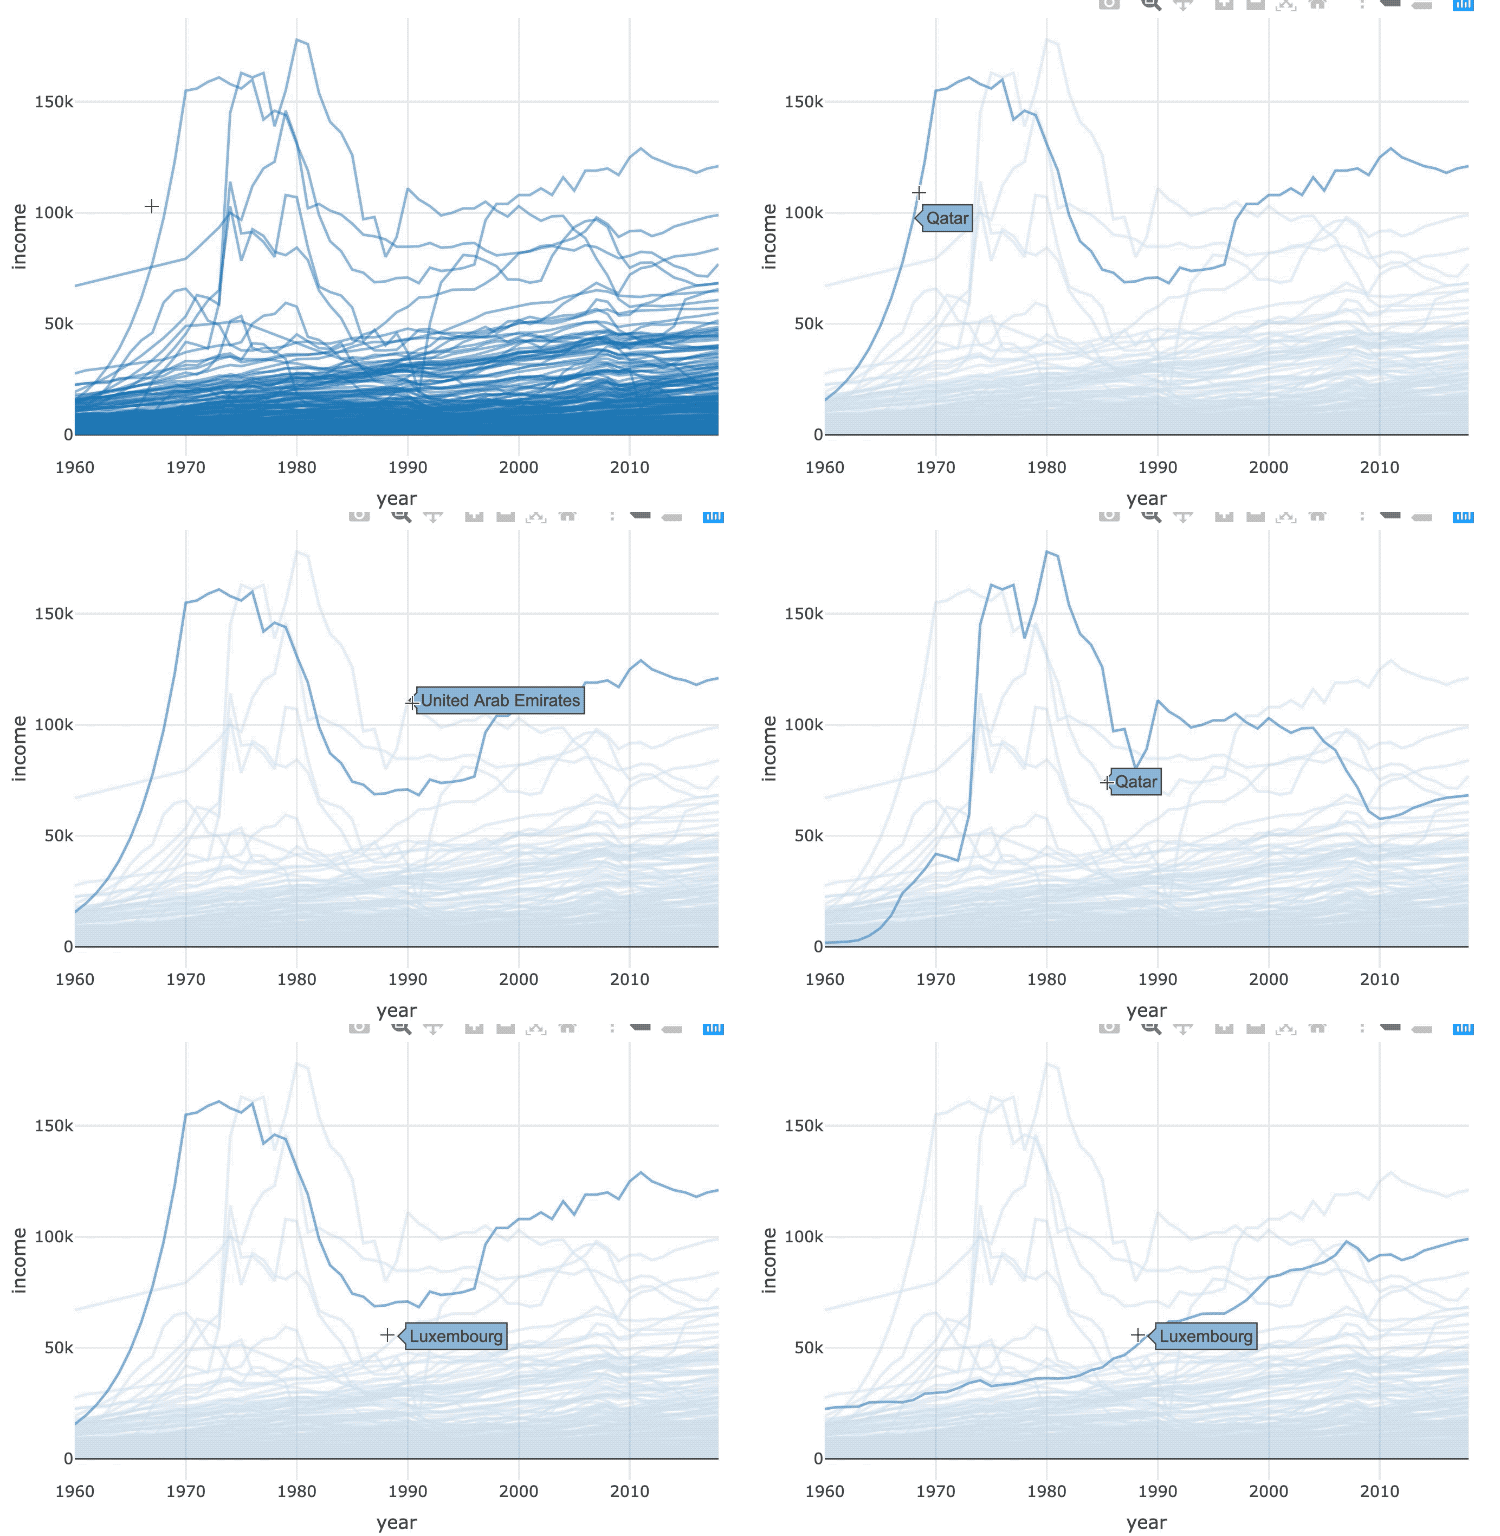
Manipulation directe
sélection par interaction avec les éléments graphiques

Manipulation indirecte
sélection via une requête hors du graphique


world_indicators %>%
SharedData$new(key = ~country) %>%
plot_ly(x = ~year, y = ~income, alpha = 0.5) %>%
group_by(country) %>%
add_lines()
world_indicators %>%
SharedData$new(key = ~country, group = "Select a country") %>%
plot_ly(x = ~year, y = ~income, alpha = 0.5) %>%
group_by(country) %>%
add_lines() %>%
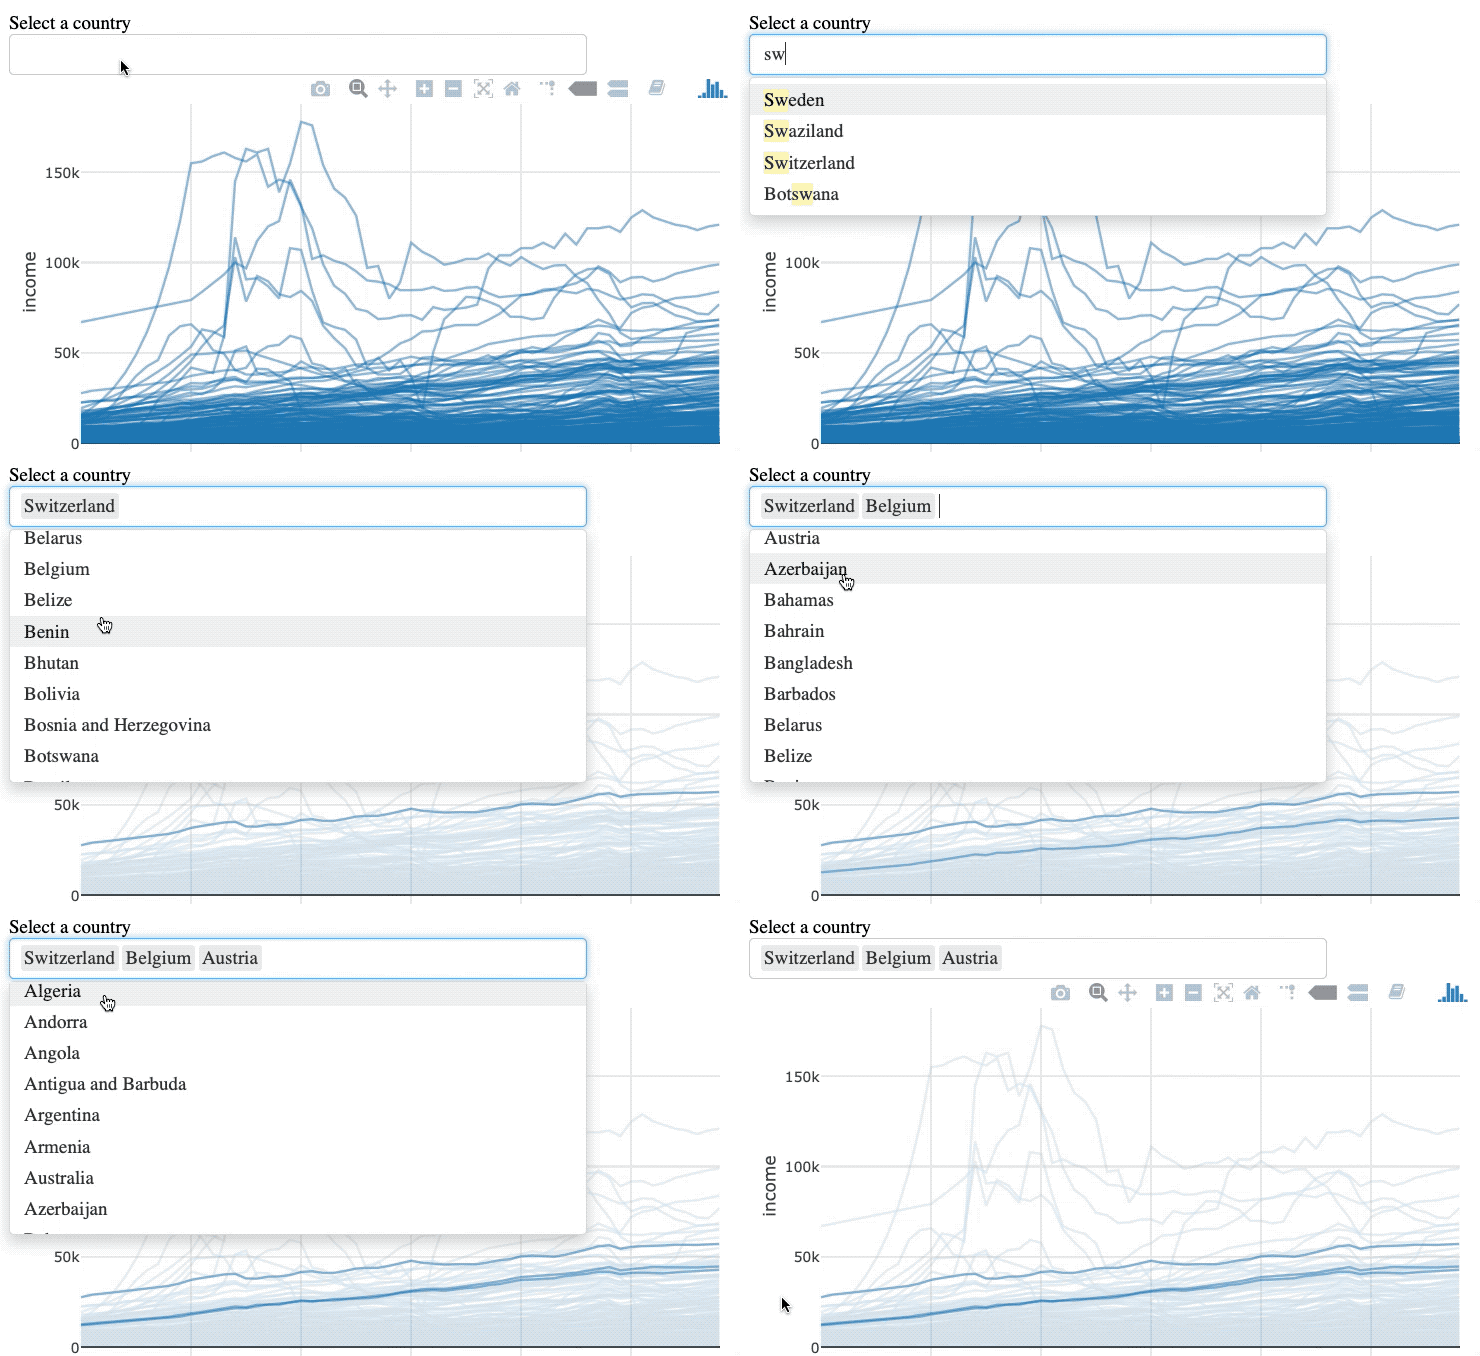
highlight(selectize = TRUE)

Visualisation de données interactive intermédiaire avec plotly en R