Récapitulatif : vues liées et gadgets de sélection

Visualisation de données interactive intermédiaire avec plotly en R

Adam Loy

Statistician, Carleton College

Vues liées

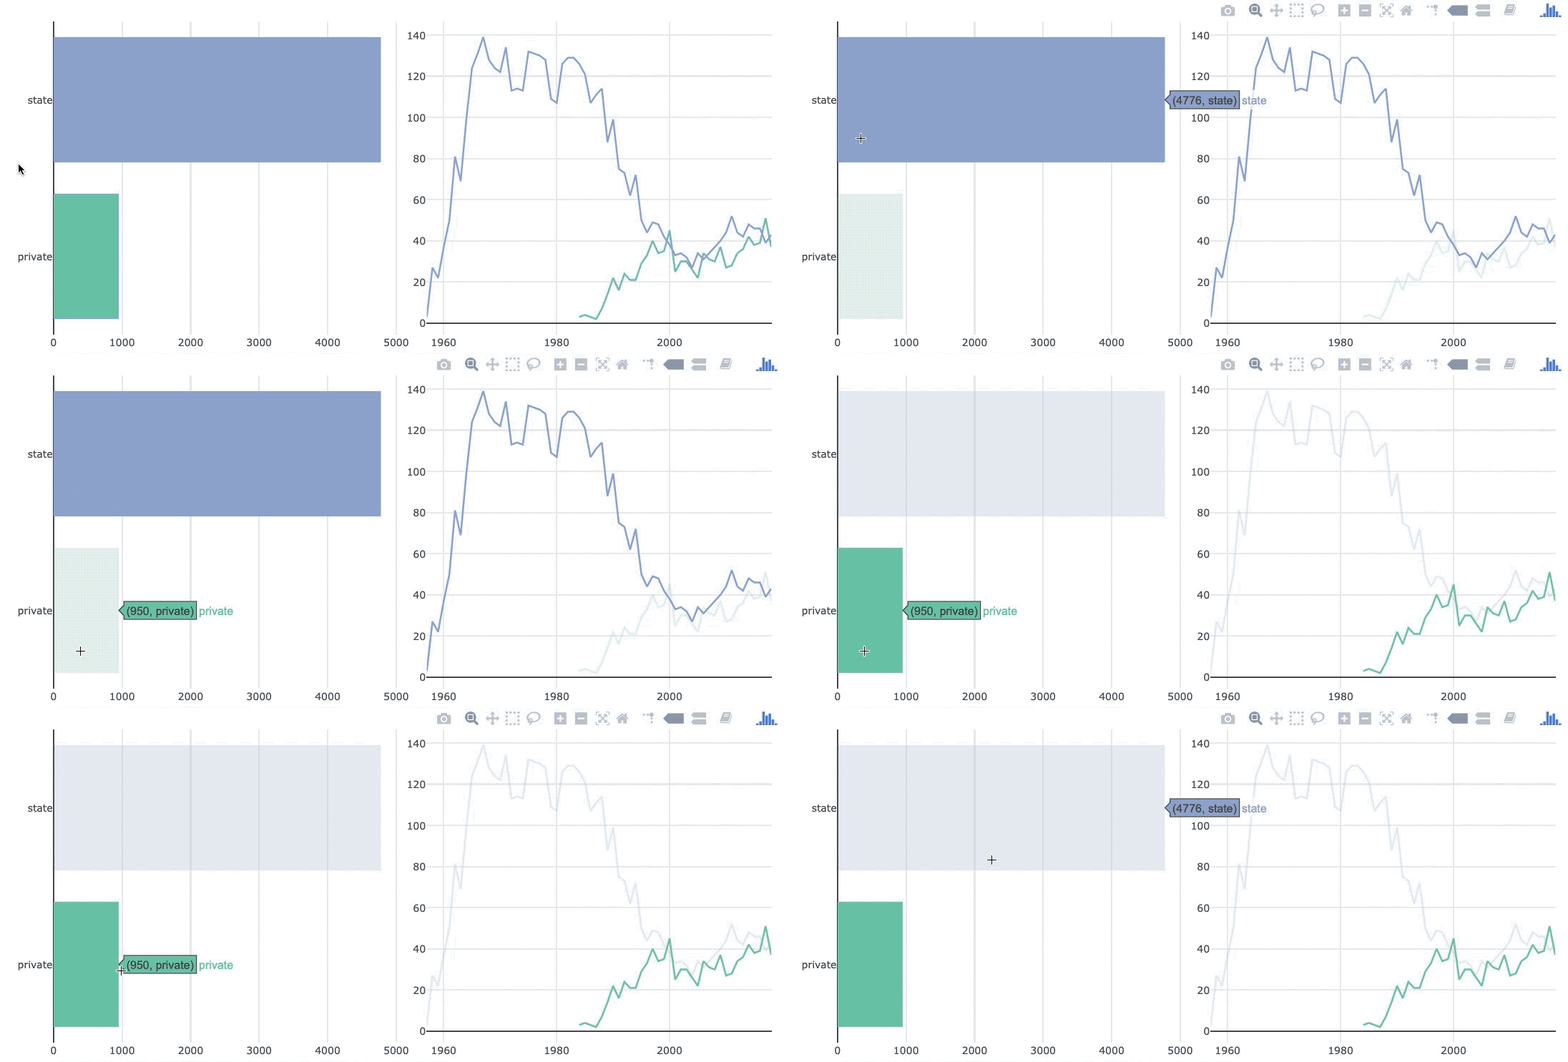
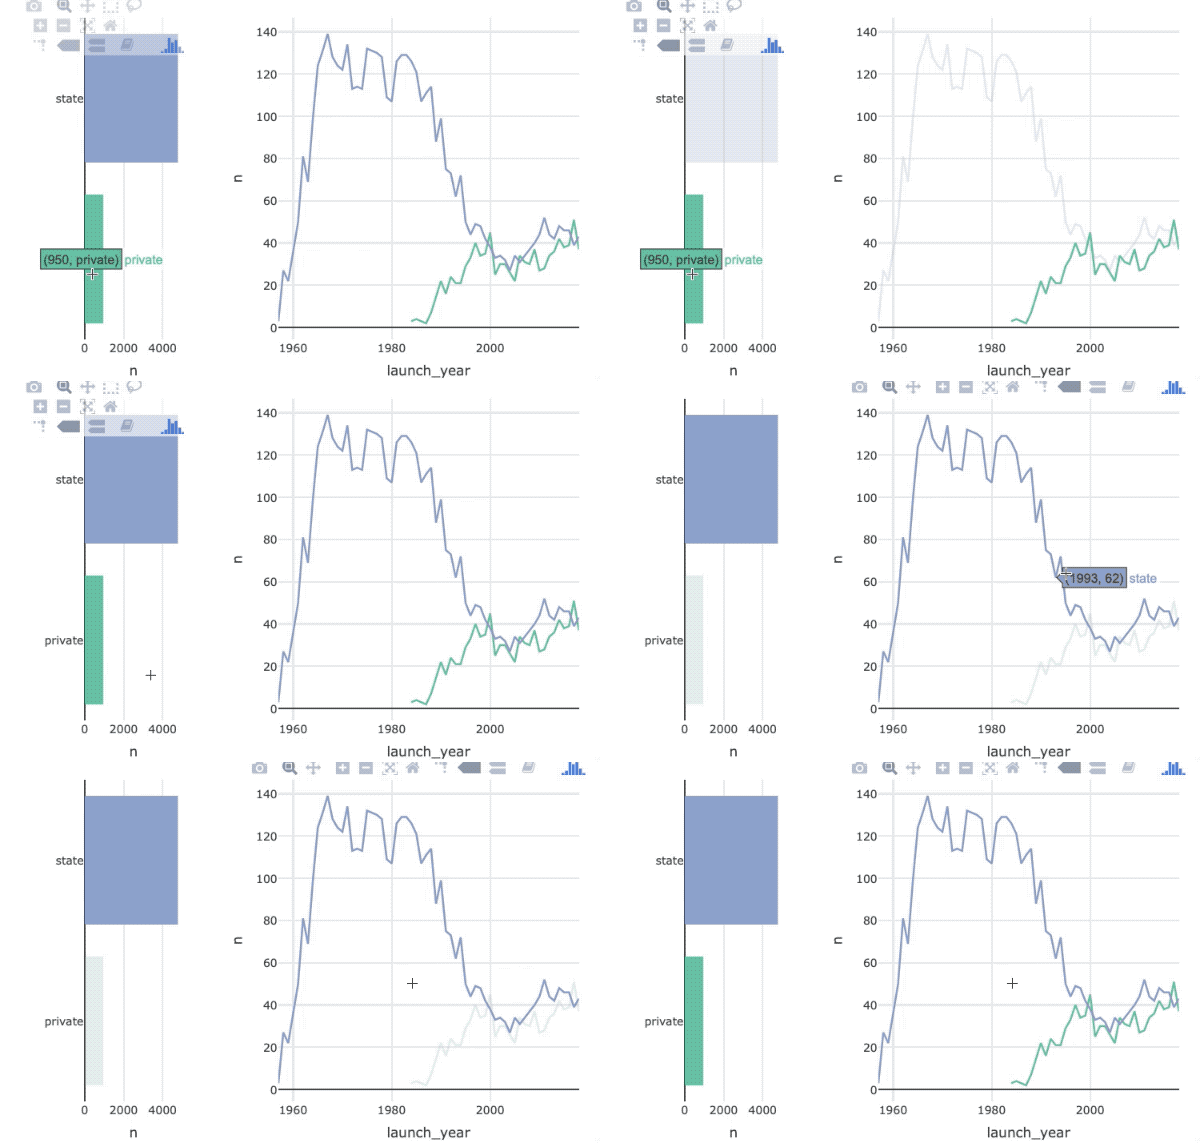
récapitulatif du chaînage ch4_3.gif

Visualisation de données interactive intermédiaire avec plotly en R

SharedData

shared_launches <- SharedData$new(launches, key = ~agency_type)

line_chart <- shared_launches %>% plot_ly() %>% group_by(launch_year, agency_type) %>% summarize(n = n()) %>% ungroup(launch_year) %>% add_lines(x = ~launch_year, y = ~n, color = ~agency_type) bar_chart <- shared_launches %>% plot_ly() %>% group_by(agency_type) %>% summarize(n = n()) %>% add_bars(y = ~fct_reorder(agency_type, n), x = ~n, color = ~agency_type) %>% layout(barmode = "overlay", yaxis = list(title = ""))
Visualisation de données interactive intermédiaire avec plotly en R

Lier des vues avec subplot()

subplot(bar_chart, line_chart) %>% 
  hide_legend() %>% 
  highlight()

diagramme_barres_type_agence.gif

Visualisation de données interactive intermédiaire avec plotly en R

Lier des vues avec bscols()

bscols(
  widths = c(4, NA),
  bar_chart %>% highlight(),
  line_chart %>% highlight()
)

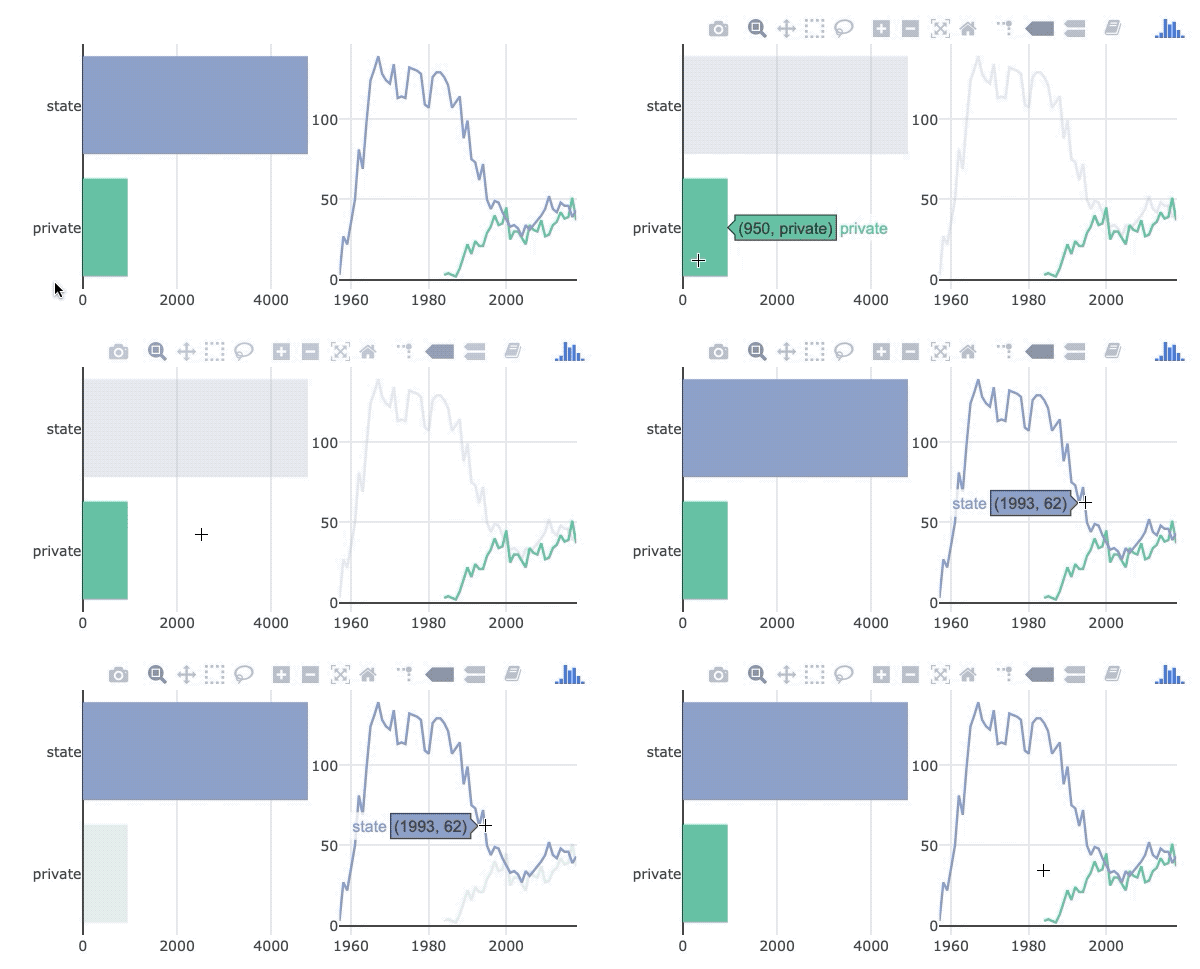
diagramme_barres_type_agence_bscols.gif

Visualisation de données interactive intermédiaire avec plotly en R

Options de highlight()

Argument Description
on événement de sélection : 'plotly_click', 'plotly_hover' ou 'plotly_selected'
off événement pour désactiver la sélection : 'plotly_doubleclick', 'plotly_deselect' ou 'plotly_relayout'
persistent Les sélections doivent-elles persister ? TRUE ou FALSE
dynamic Ajouter un gadget pour changer les couleurs ? TRUE ou FALSE
color chaîne de couleur(s) à utiliser pour la mise en évidence des sélections
selectize Ajouter un gadget selectize.js pour sélectionner des clés ? TRUE ou FALSE
Visualisation de données interactive intermédiaire avec plotly en R

Gadgets de sélection

bscols(widths = c(2, NA),
  list(filter_checkbox(id = "agency", label = "Agency type", shared_launches, ~agency_type),
       filter_select(id = "agency2", label = "Agency type dropdown", shared_launches, ~agency_type)),
  line_chart %>% highlight(on = "plotly_selected", off = "plotly_deselect")
)

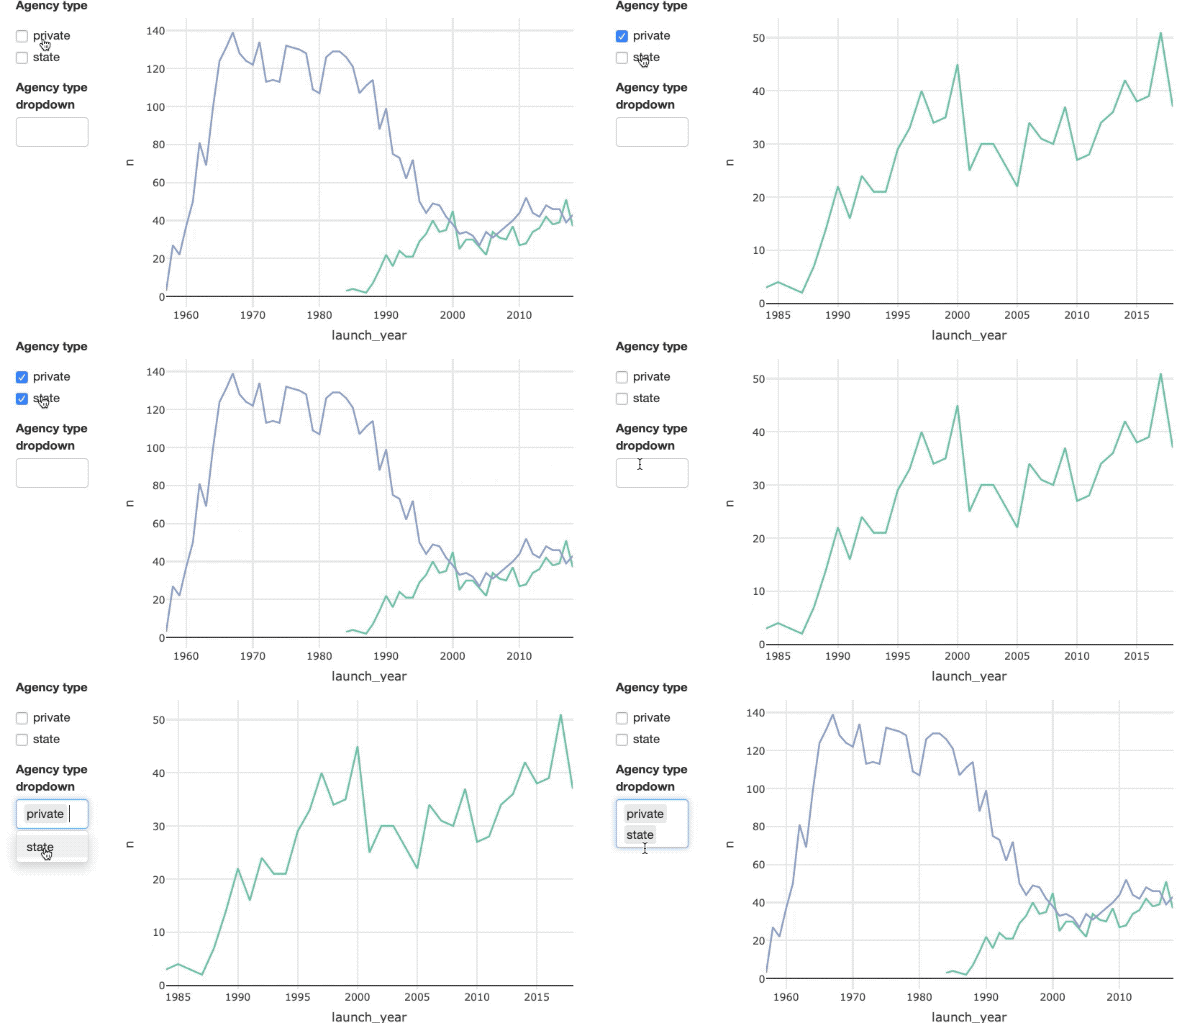
sélecteurs_type_agence.gif

Visualisation de données interactive intermédiaire avec plotly en R

Véhicules de lancement

glimpse(lv)
Rows: 1,578
Columns: 17
$ name         <chr> "?", "Unknown", "N-1 11A52", "Saturn V", "S…
$ family       <chr> "Unknown", "Unknown", "N-1", "SaturnV", "Sa…
$ sfamily      <chr> NA, NA, "OKB1", "MSFC", "MSFC", "SPX", "SPX…
$ manufacturer <chr> NA, NA, NA, NA, "2", NA, NA, NA, NA, NA, NA…
$ variant      <chr> NA, NA, NA, NA, NA, NA, NA, NA, NA, NA, NA,…
$ alias        <dbl> 1, 1, 1, 1, 1, 1, 1, 1, 0, 0, 1, 1, 1, 1, 1…
$ min_stage    <dbl> 1, 1, 3, 4, 3, 1, 2, 3, 1, 1, 2, 3, 6, 3, 6…
$ max_stage    <chr> "0.0  0.00", "0.0  0.00", "105.3 14.00", "1…
$ length       <chr> "0.0", "0.0", "2788.0", "2913.0", "2822.0",…
$ diameter     <dbl> 0, 0, 70000, 118000, 75000, 0, 150000, 2440…
$ launch_mass  <lgl> NA, NA, NA, NA, NA, NA, NA, NA, NA, NA, NA,…
$ leo_capacity <dbl> 0, 0, 0, 0, 0, 0, 0, 0, 0, 0, 0, 0, 4350, 0…
$ gto_capacity <lgl> NA, NA, NA, NA, NA, NA, NA, NA, NA, NA, NA,…
$ to_thrust    <dbl> 0, 0, 45300, 34030, 34030, 12000, 72500, 28…
$ class        <chr> "R", "R", "O", "O", "O", "R", "O", "O", "O"…
$ apogee       <dbl> 0, 0, 200, 400000, 500, 20, 200, 600, 250, …
$ range        <dbl> NA, NA, NA, NA, NA, NA, NA, NA, NA, NA, NA,…
Visualisation de données interactive intermédiaire avec plotly en R

Passons à la pratique !

Visualisation de données interactive intermédiaire avec plotly en R

Preparing Video For Download...