Modeling with Data in the Tidyverse
Albert Y. Kim
Assistant Professor of Statistical and Data Sciences
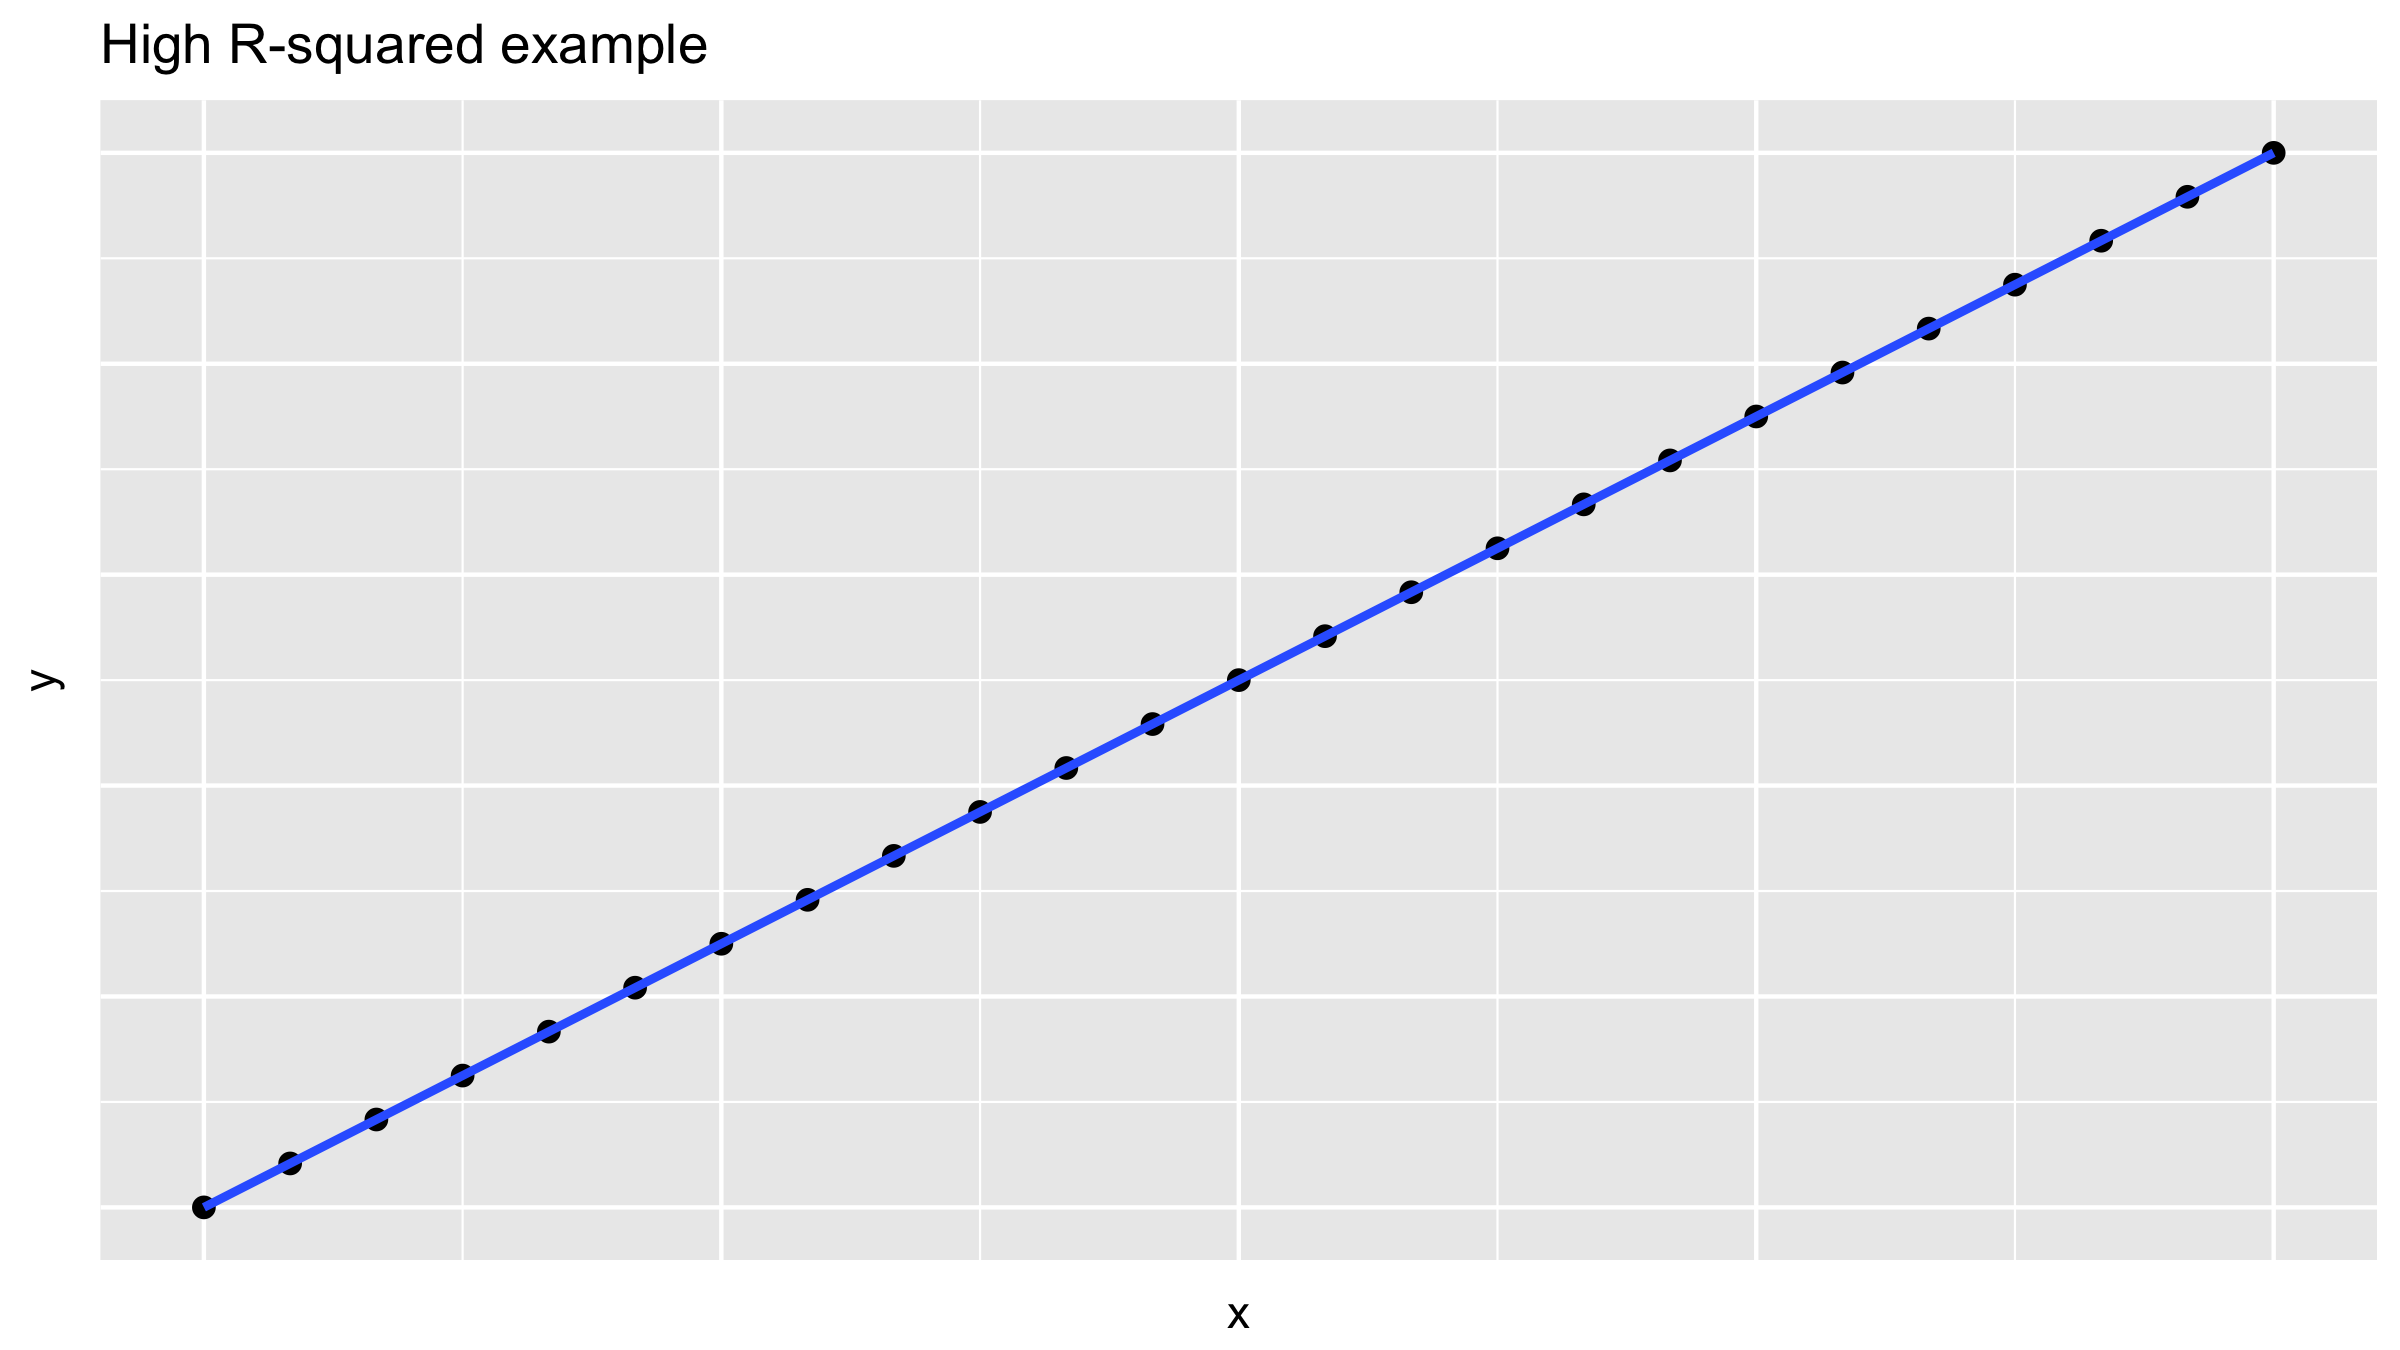
$R^2 = 1 - \frac{\text{Var}(\text{residuals})}{\text{Var}(y)}$
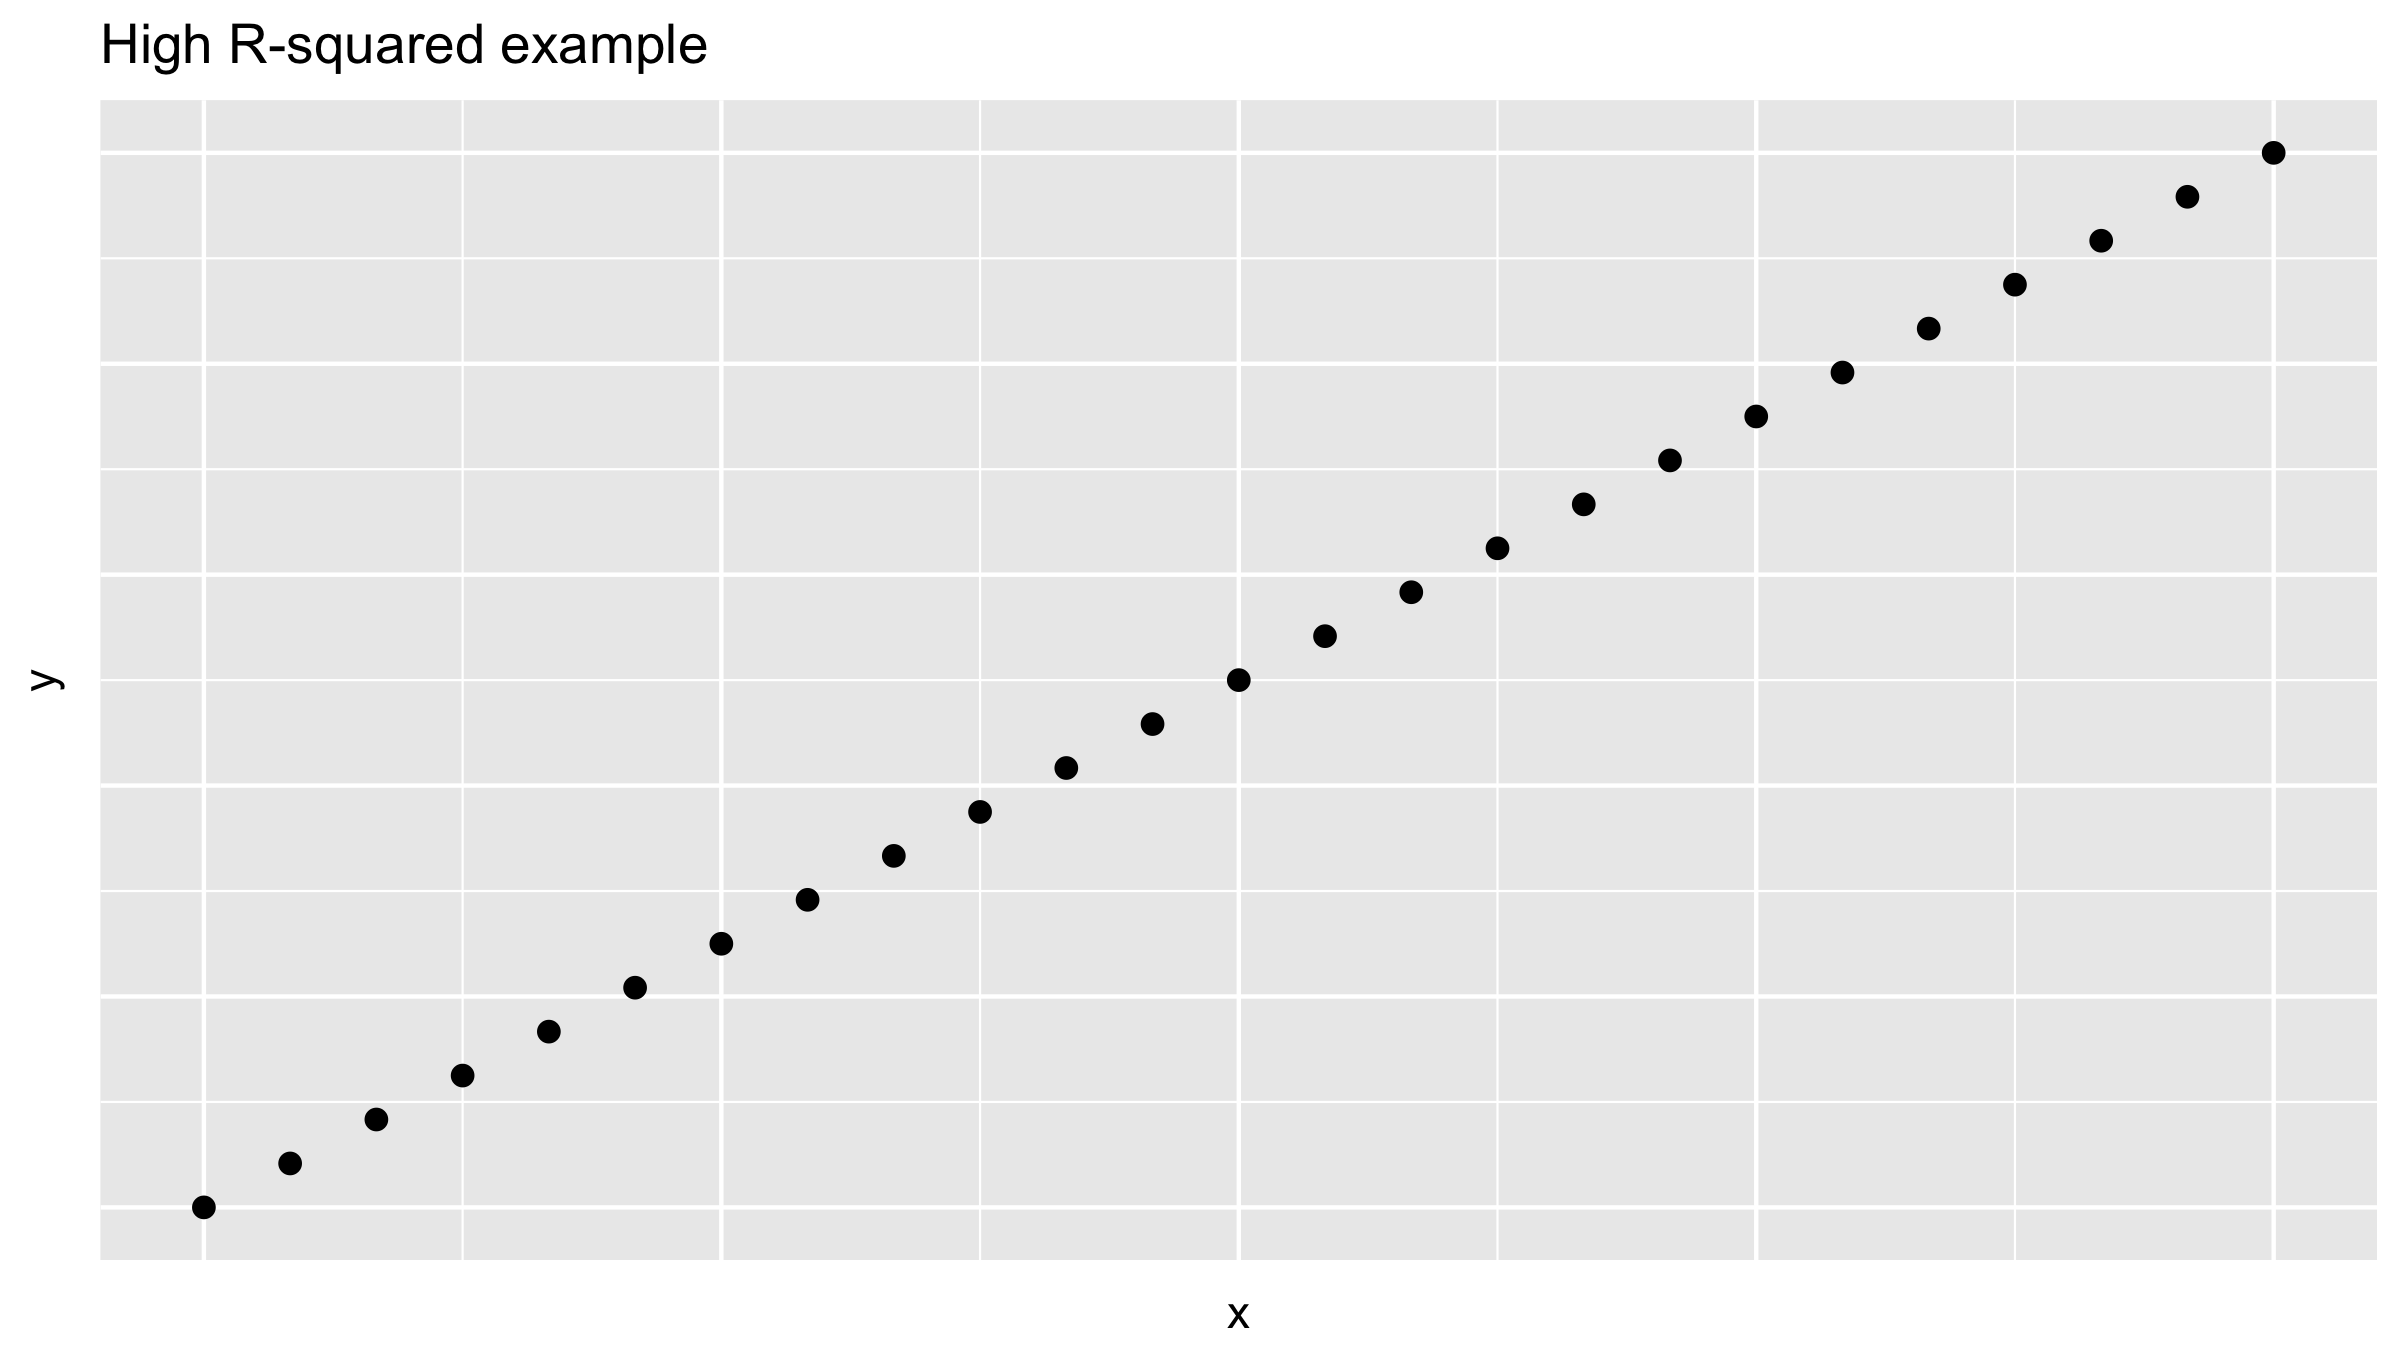
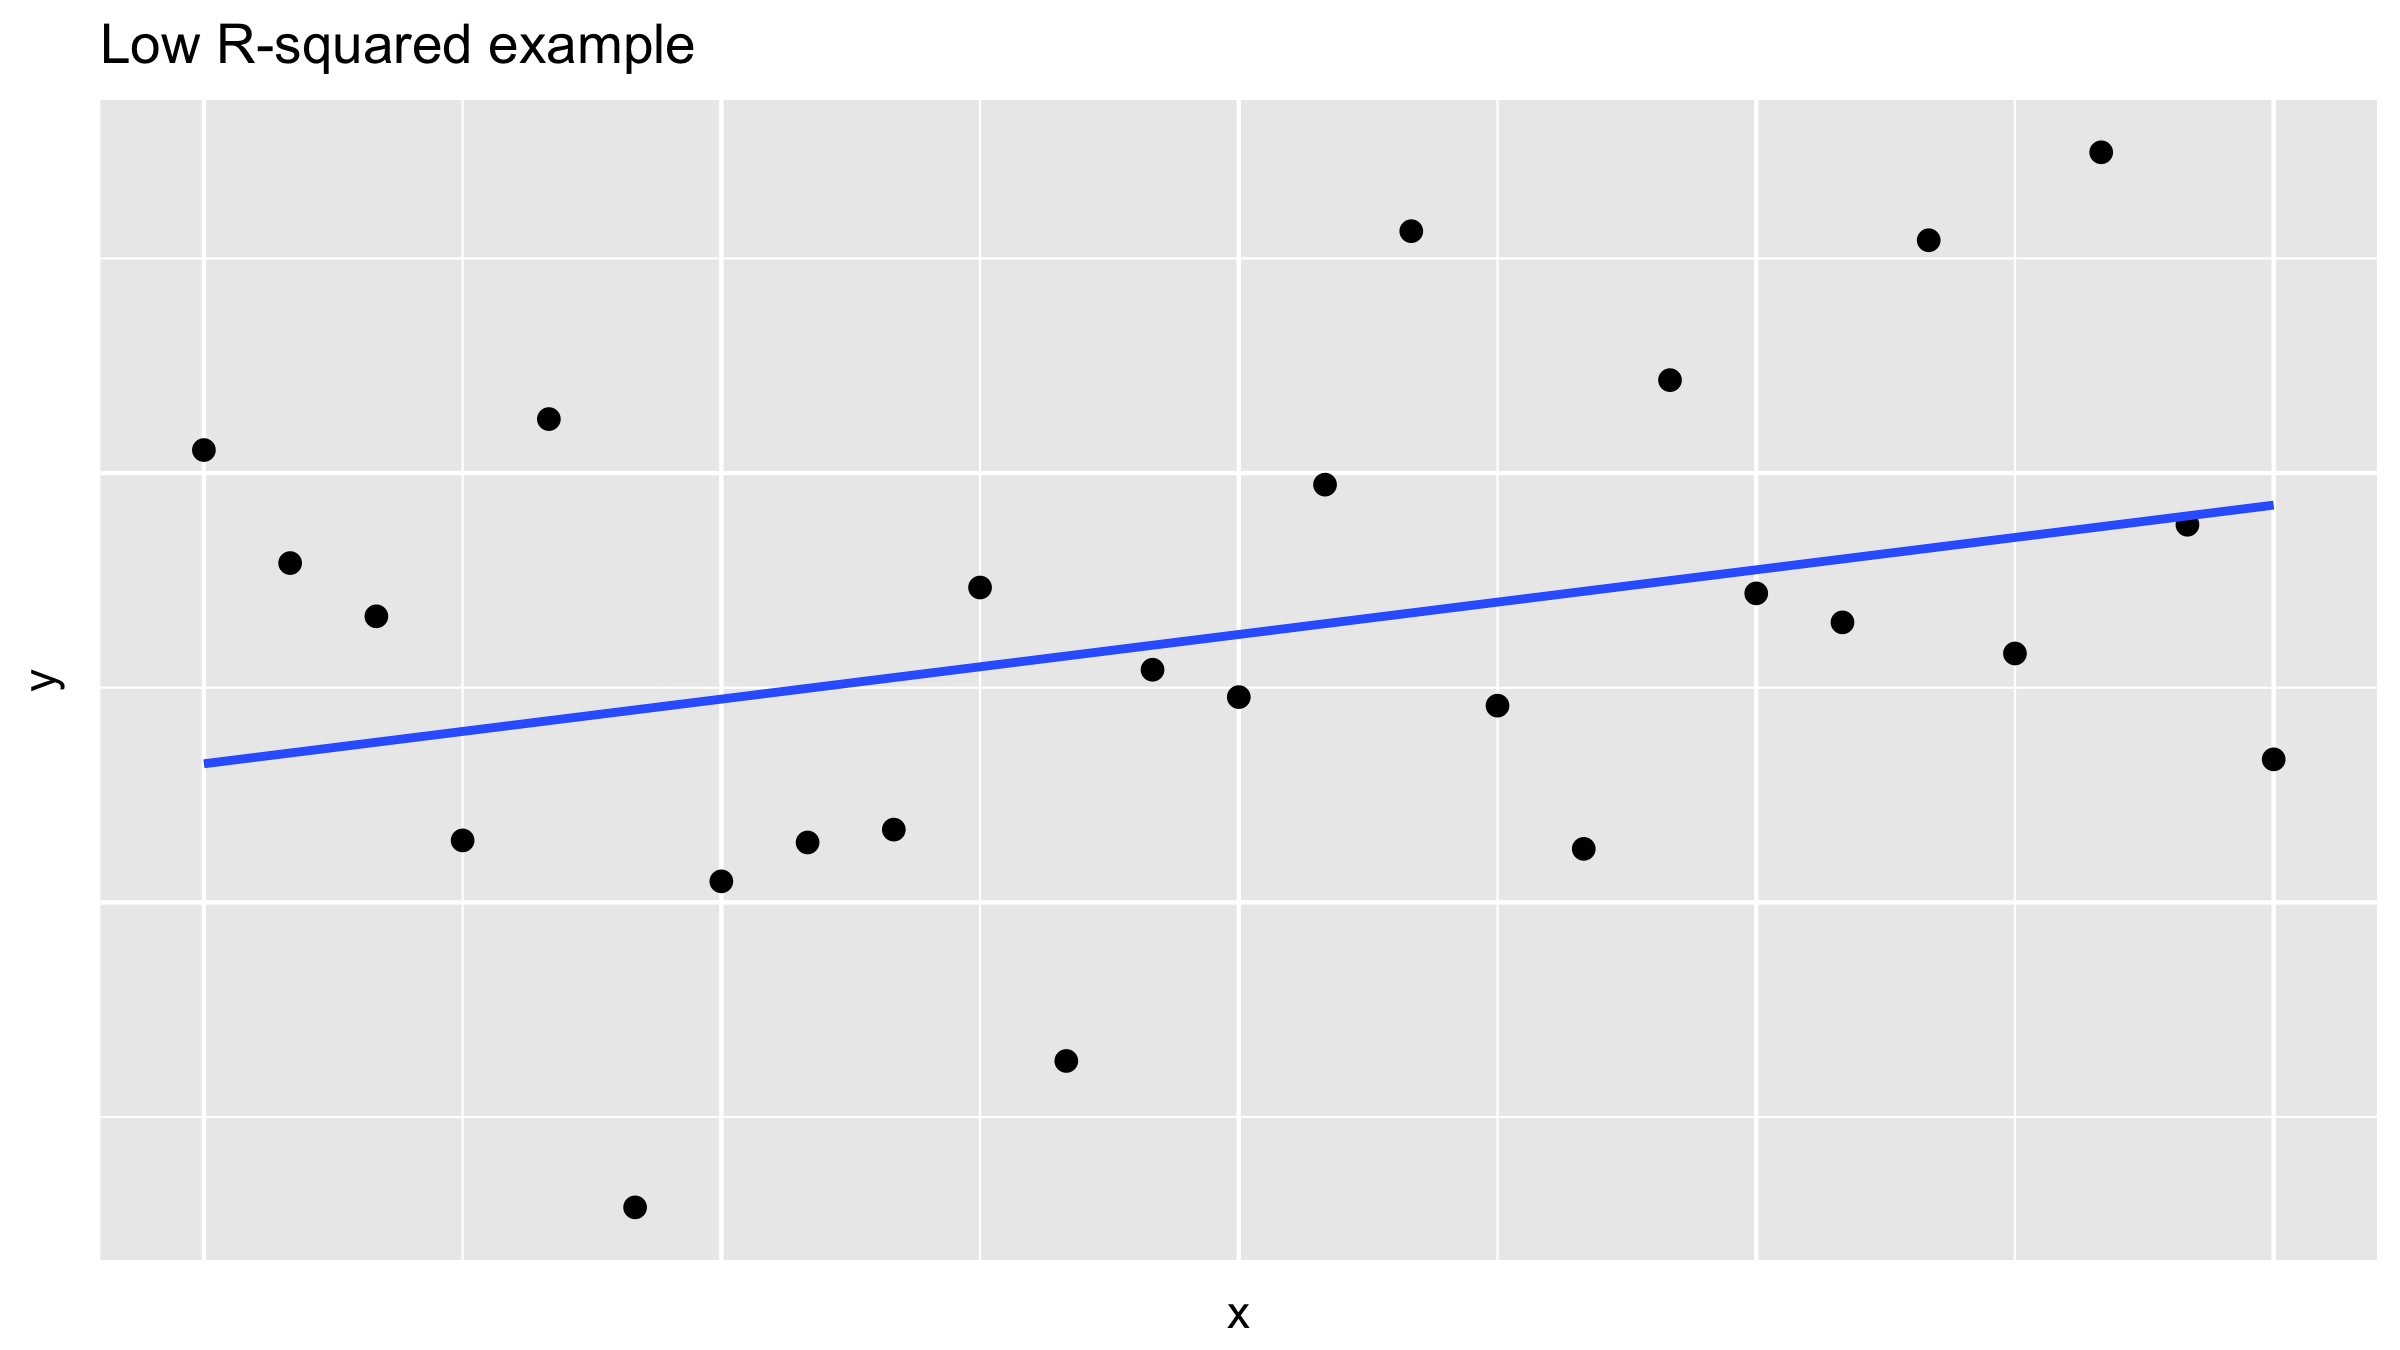
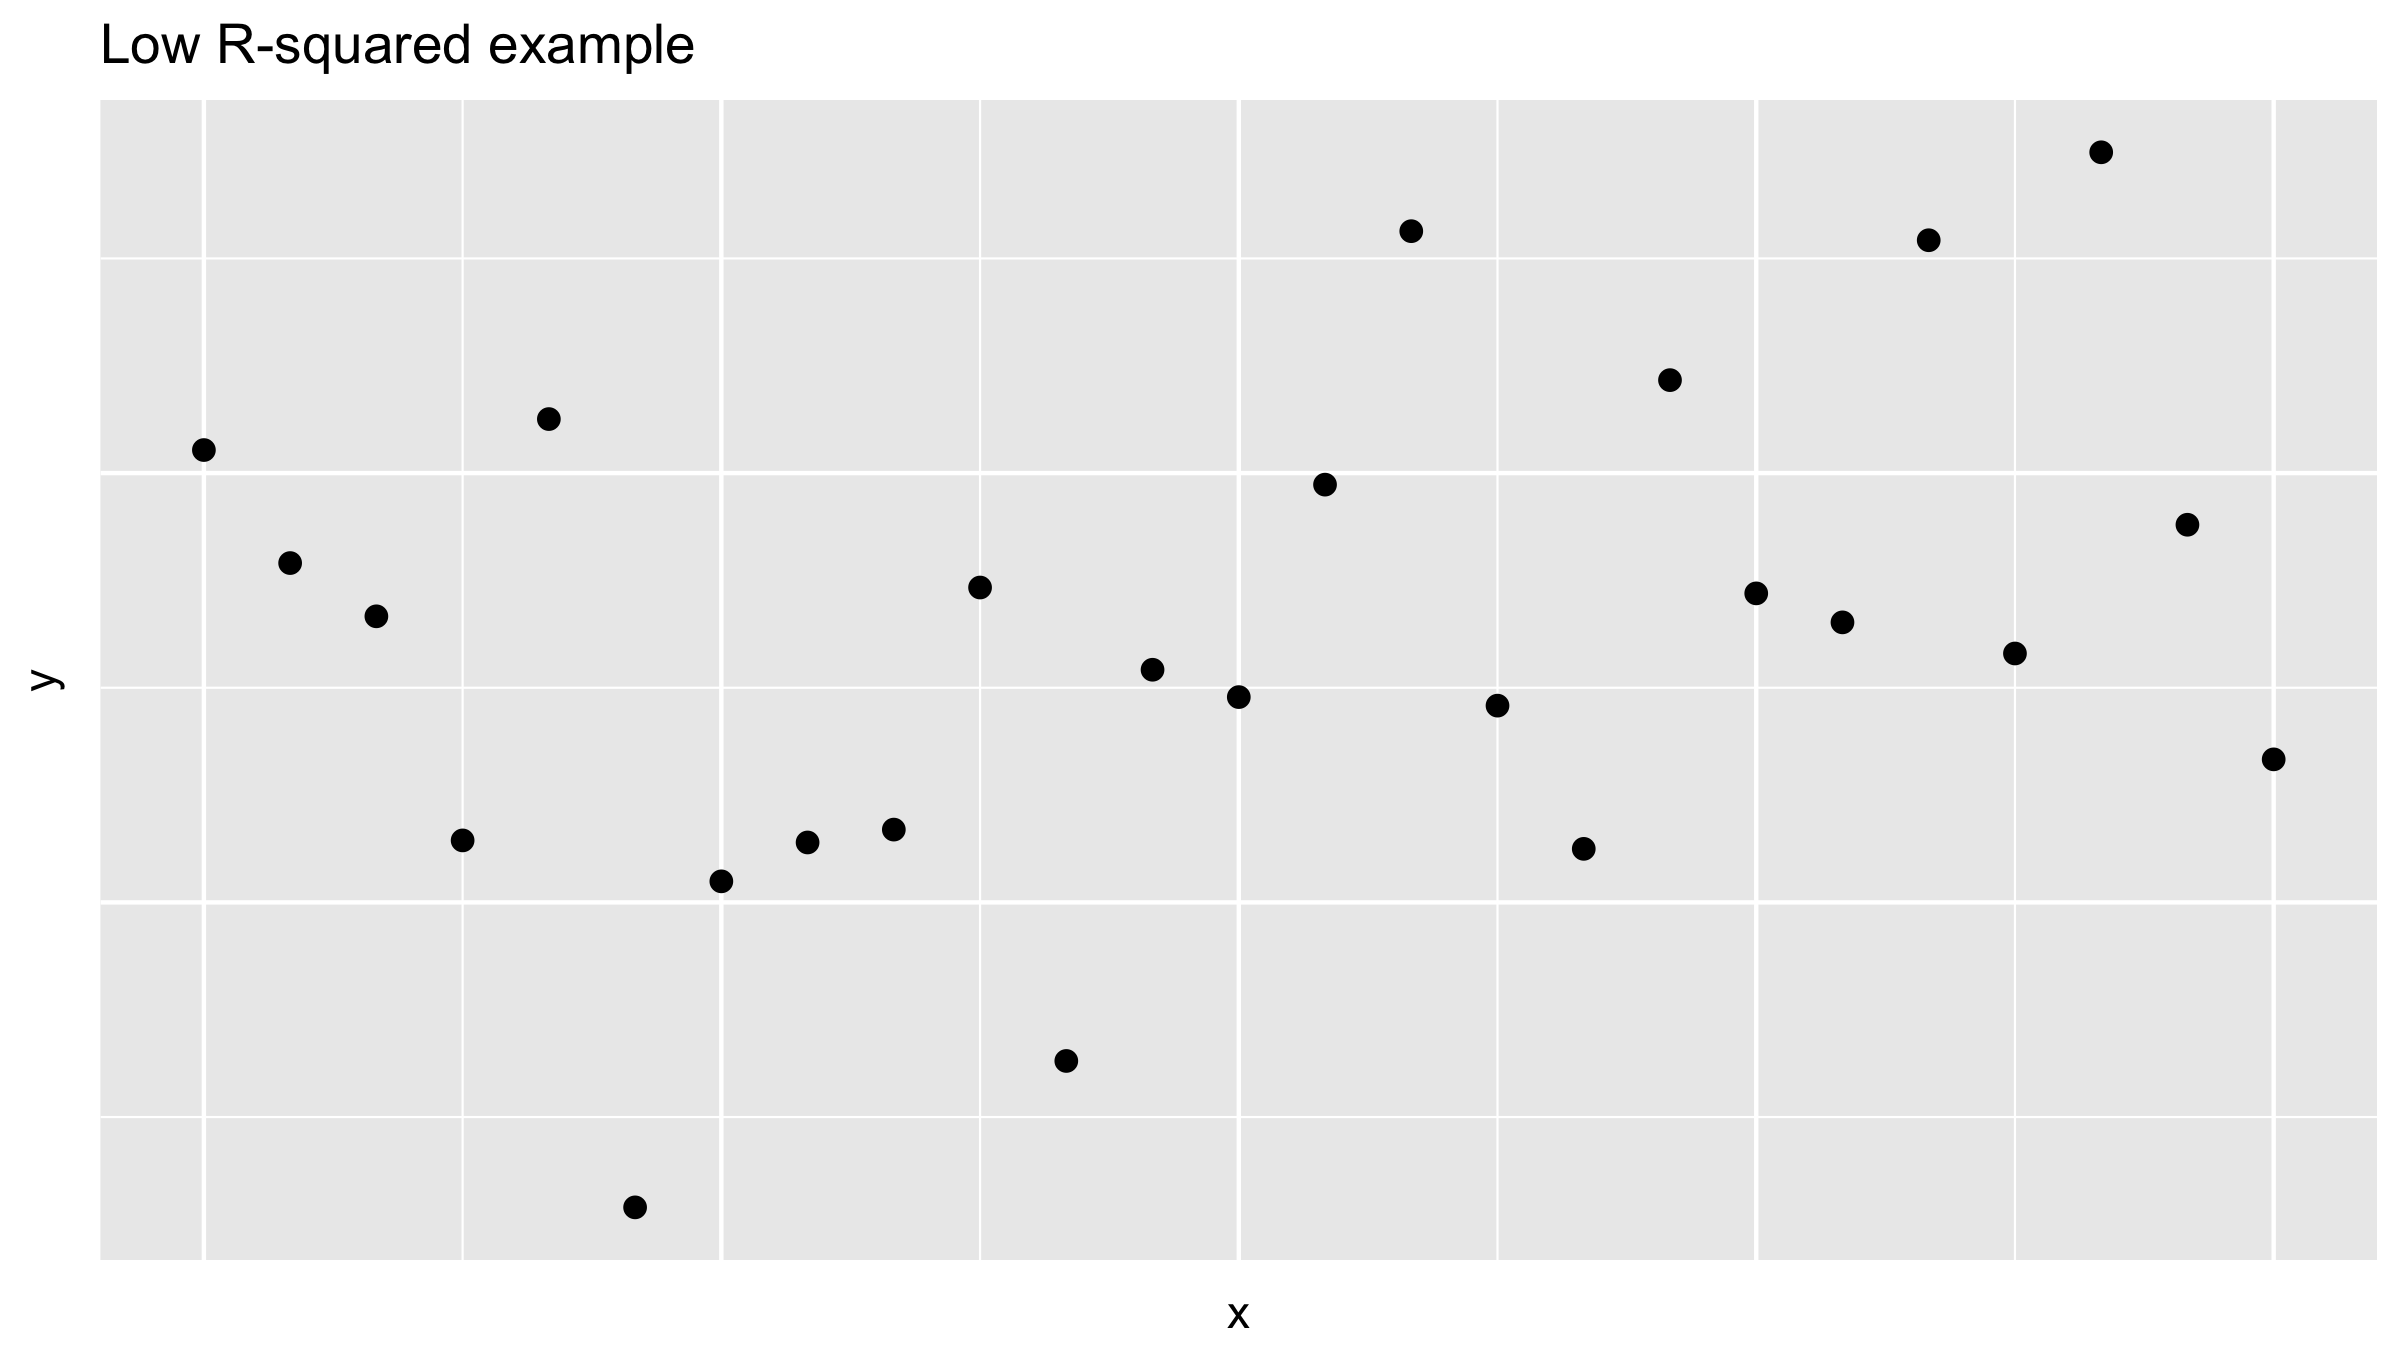
$$
Since $\text{Var}(y) \geq \text{Var}(\text{residuals})$ and $$
$R^2 = 1 - \frac{\text{Var}(\text{residuals})}{\text{Var}(y)} = \frac{\text{Var}(y) - \text{Var}(\text{residuals})}{\text{Var}(y)}$
$$
$R^2$'s interpretation is: the proportion of the total variation in the outcome variable $y$ that the model explains.
# Model 1: price as a function of size and year built
model_price_1 <- lm(log10_price ~ log10_size + yr_built,
data = house_prices)
get_regression_points(model_price_1) %>%
summarize(r_squared = 1 - var(residual)/var(log10_price))
# A tibble: 1 x 1
r_squared
<dbl>
1 0.483
# Model 3: price as a function of size and condition
model_price_3 <- lm(log10_price ~ log10_size + condition,
data = house_prices)
get_regression_points(model_price_3) %>%
summarize(r_squared = 1 - var(residual)/var(log10_price))
# A tibble: 1 x 1
r_squared
<dbl>
1 0.462
Modeling with Data in the Tidyverse