Explaining teaching score with gender
Modeling with Data in the Tidyverse

Albert Y. Kim
Assistant Professor of Statistical and Data Sciences
Exploratory data visualization
library(ggplot2)
library(dplyr)
library(moderndive)

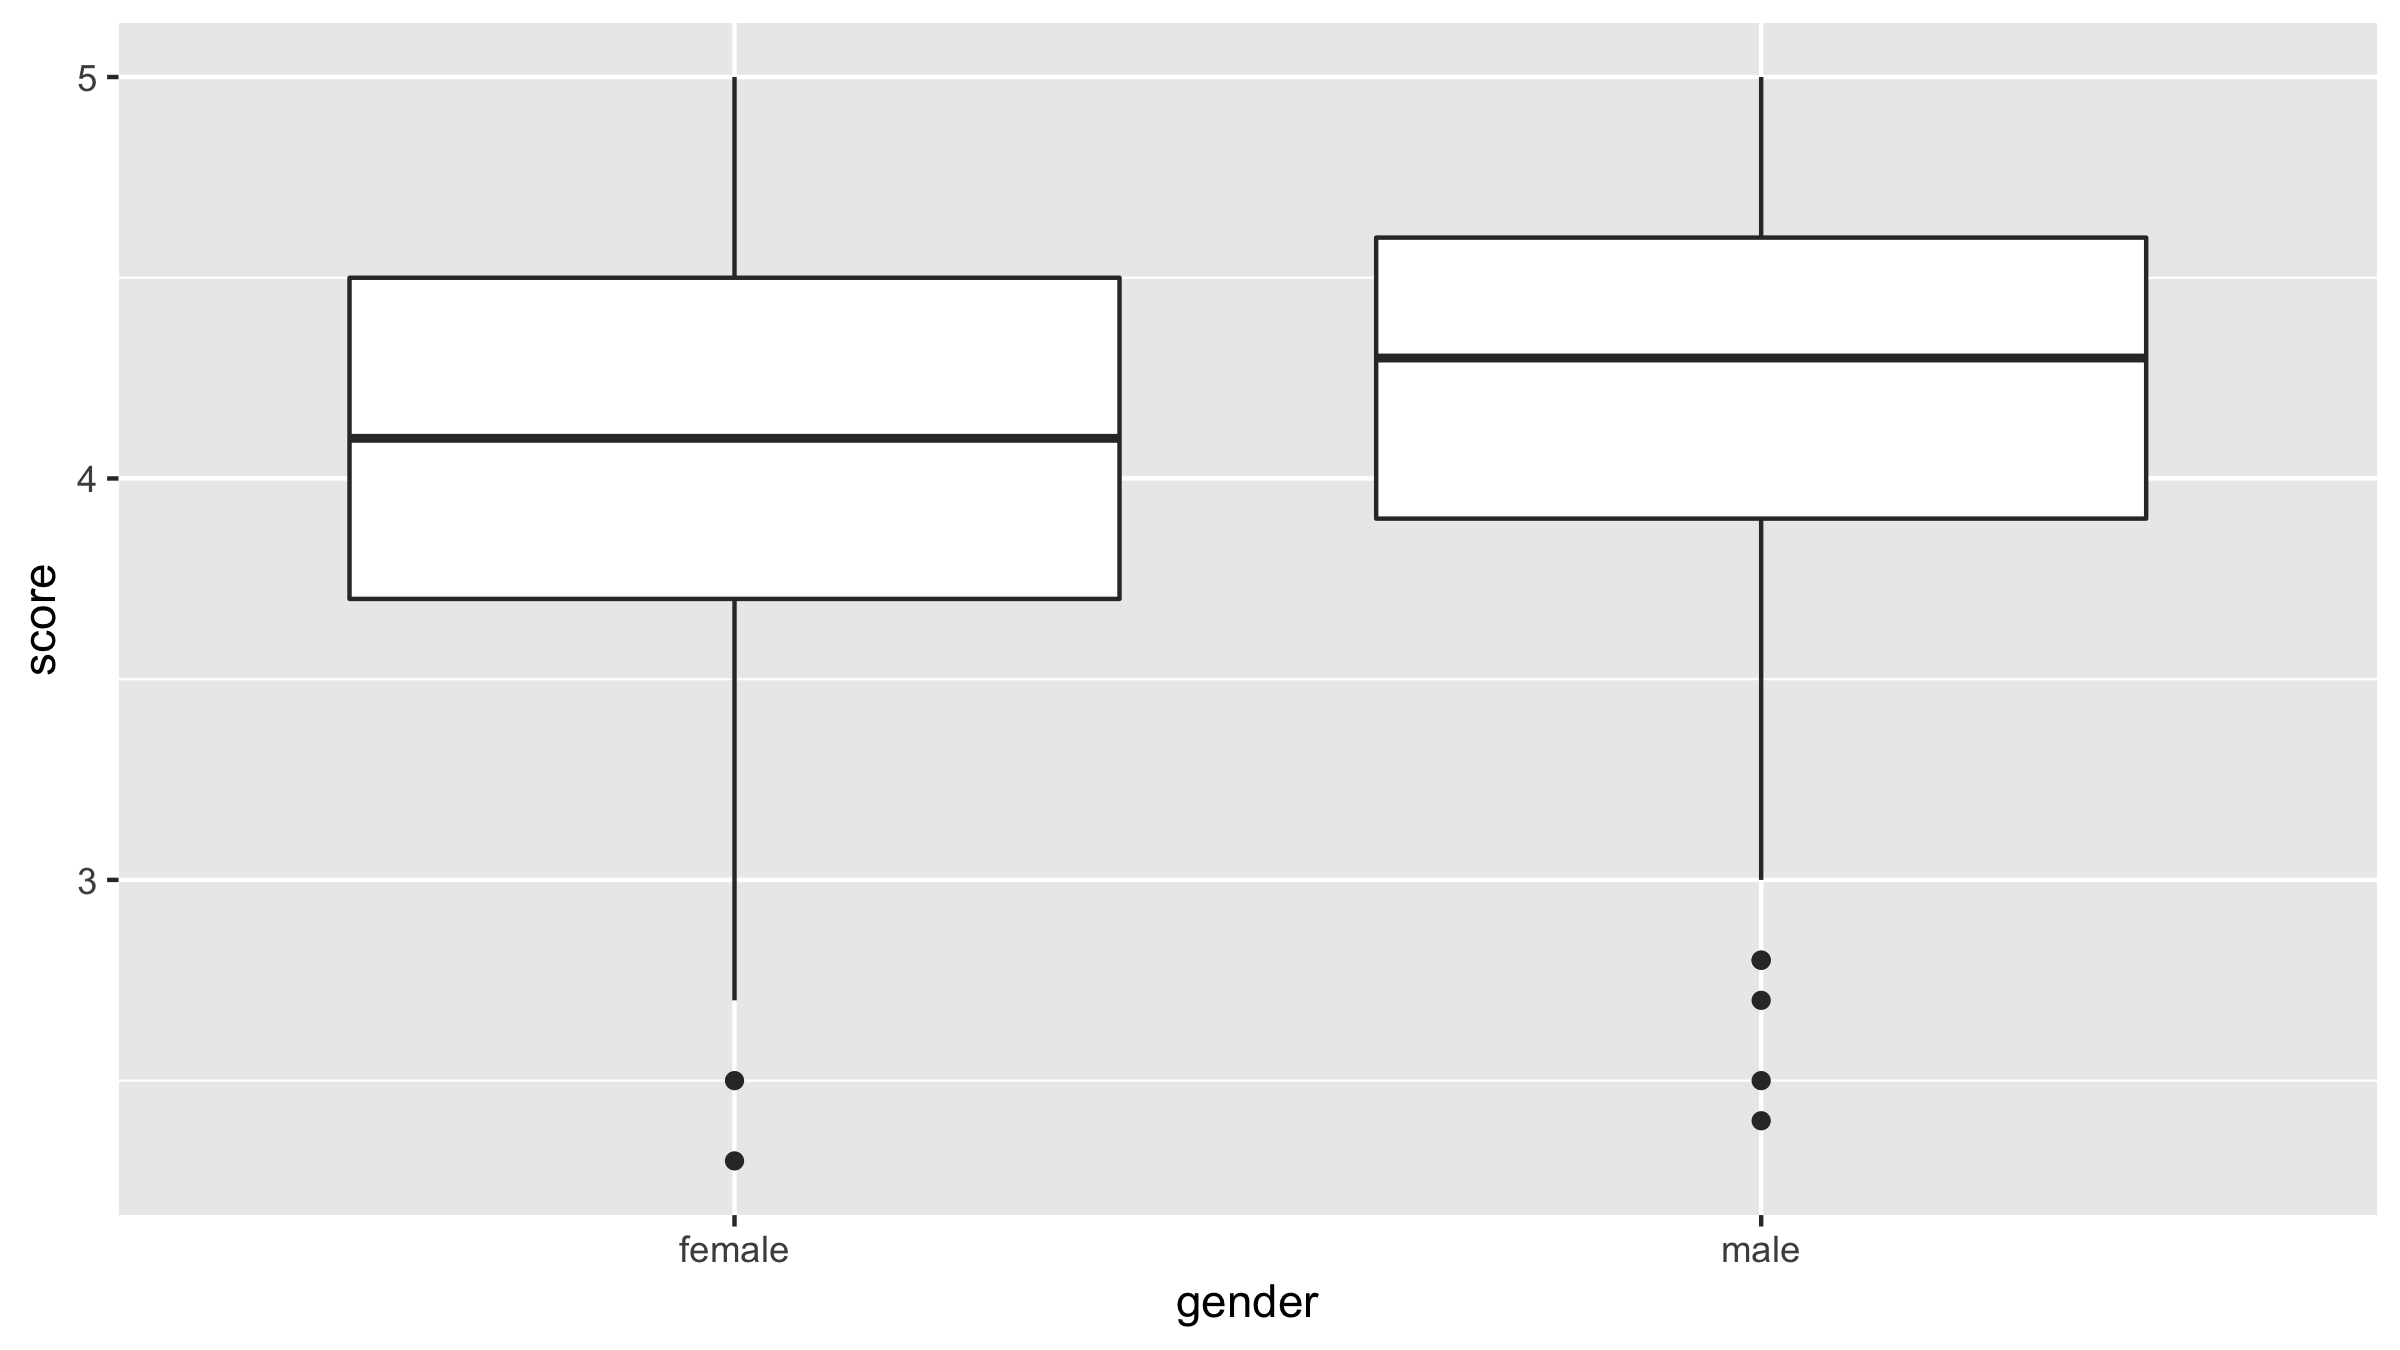
ggplot(evals, aes(x = gender, y = score)) +
  geom_boxplot() +
  labs(x = "gender", y = "score")
Boxplot of score over gender

Facetted histogram
library(ggplot2)
library(dplyr)
library(moderndive)

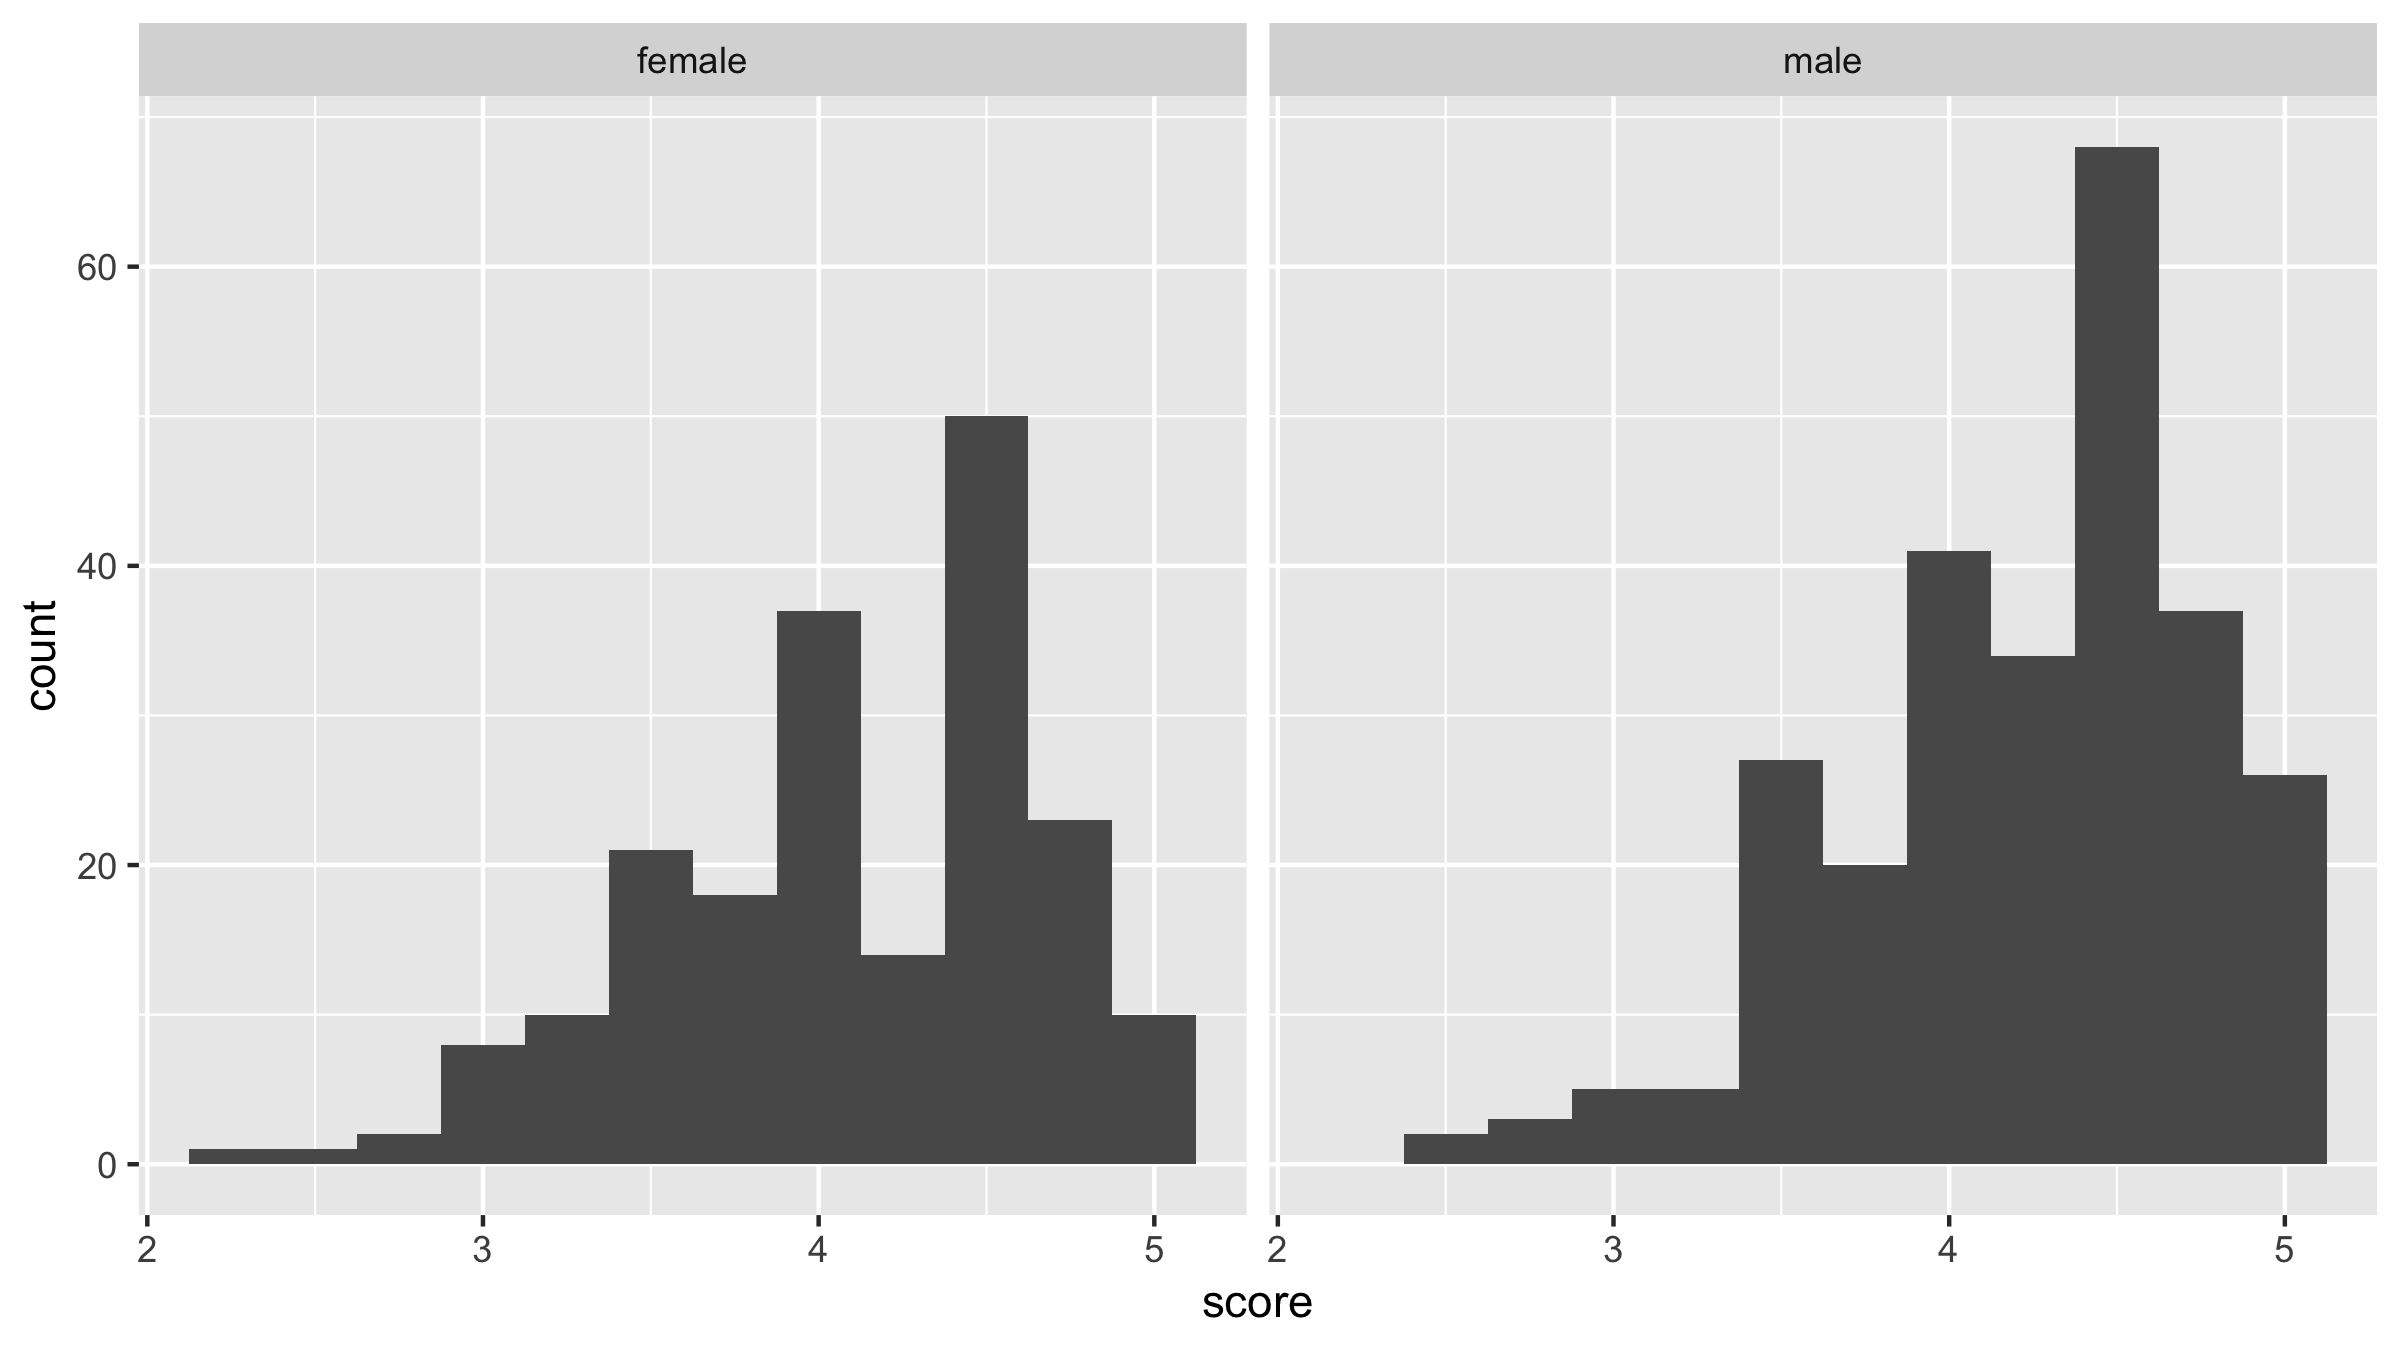
ggplot(evals, aes(x = score)) +
  geom_histogram(binwidth = 0.25) +
  facet_wrap(~gender) +
  labs(x = "gender", y = "score")
Facetted histogram

Fitting a regression model
# Fit regression model
model_score_3 <- lm(score ~ gender, data = evals)

# Get regression table
get_regression_table(model_score_3)
# A tibble: 2 x 7
  term       estimate std_error statistic p_value...
  <chr>         <dbl>     <dbl>     <dbl>   <dbl>...
1 intercept     4.09      0.039    106.     0...
2 gendermale    0.142     0.051      2.78   0.006...
Fitting a regression model
# Compute group means based on gender
evals %>%
  group_by(gender) %>%
  summarize(avg_score = mean(score))
# A tibble: 2 x 2
  gender avg_score
  <fct>      <dbl>
1 female      4.09
2 male        4.23
A different categorical explanatory variable: rank
evals %>%
  group_by(rank) %>%
  summarize(n = n())
# A tibble: 3 x 2
  rank             n
  <fct>        <int>
1 teaching       102
2 tenure track   108
3 tenured        253
Let's practice!
Modeling with Data in the Tidyverse

