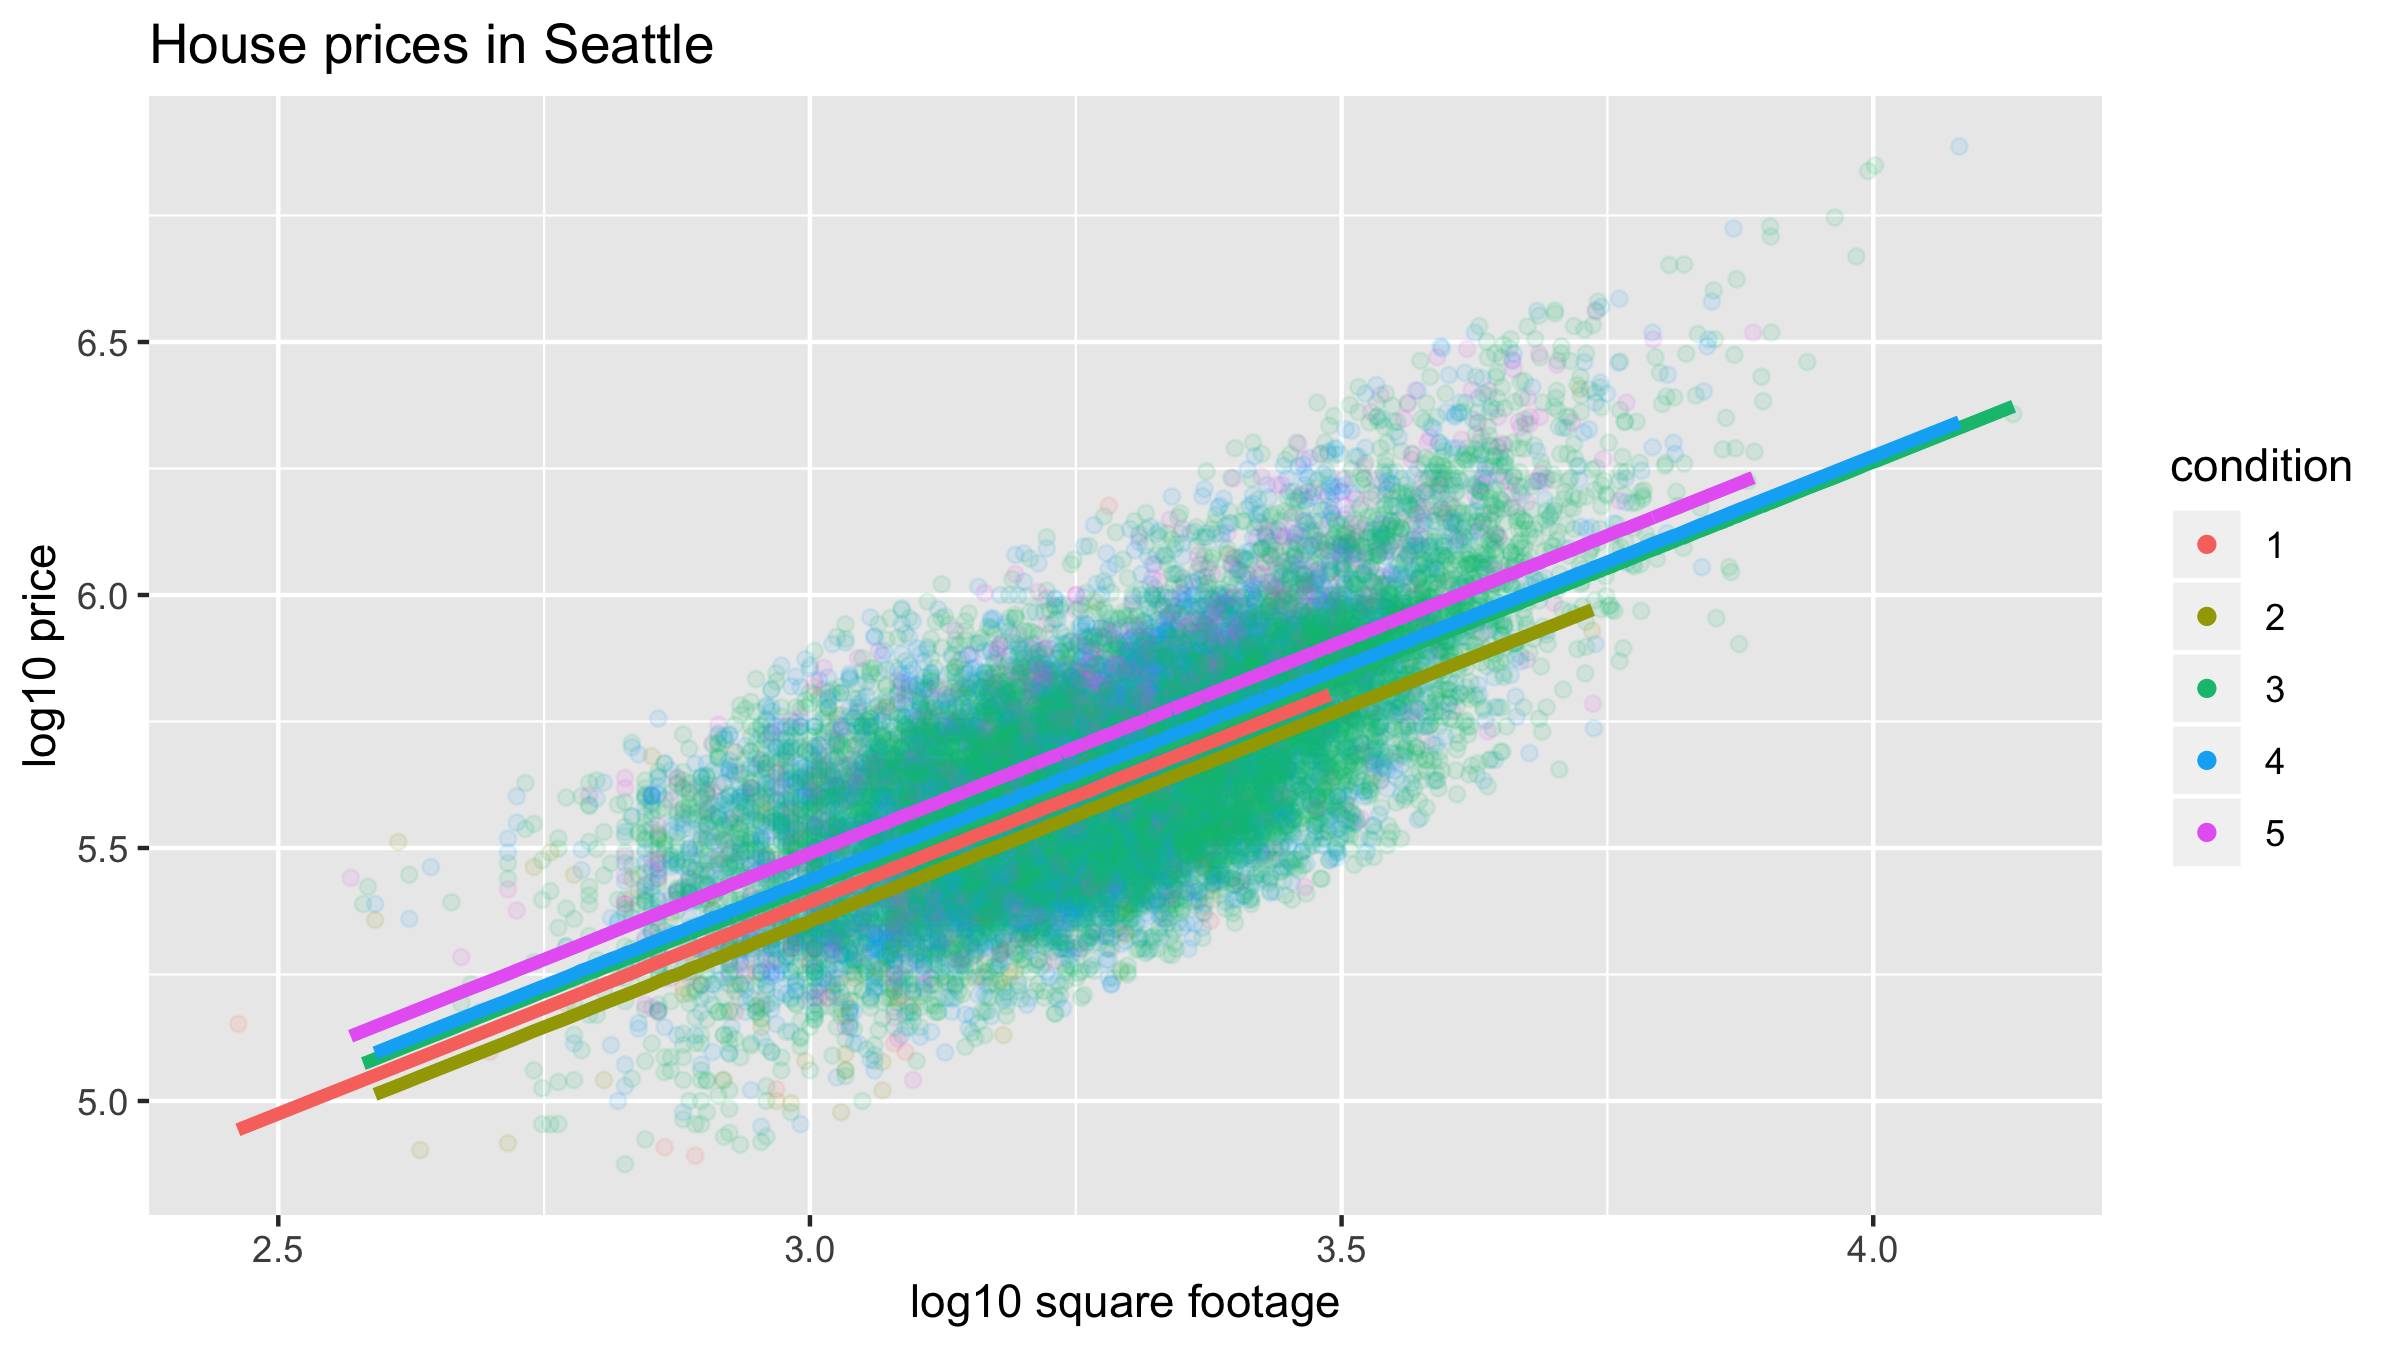
Predicting house price using size & condition
Modeling with Data in the Tidyverse

Albert Y. Kim
Assistant Professor of Statistical and Data Sciences
Refresher: Parallel slopes
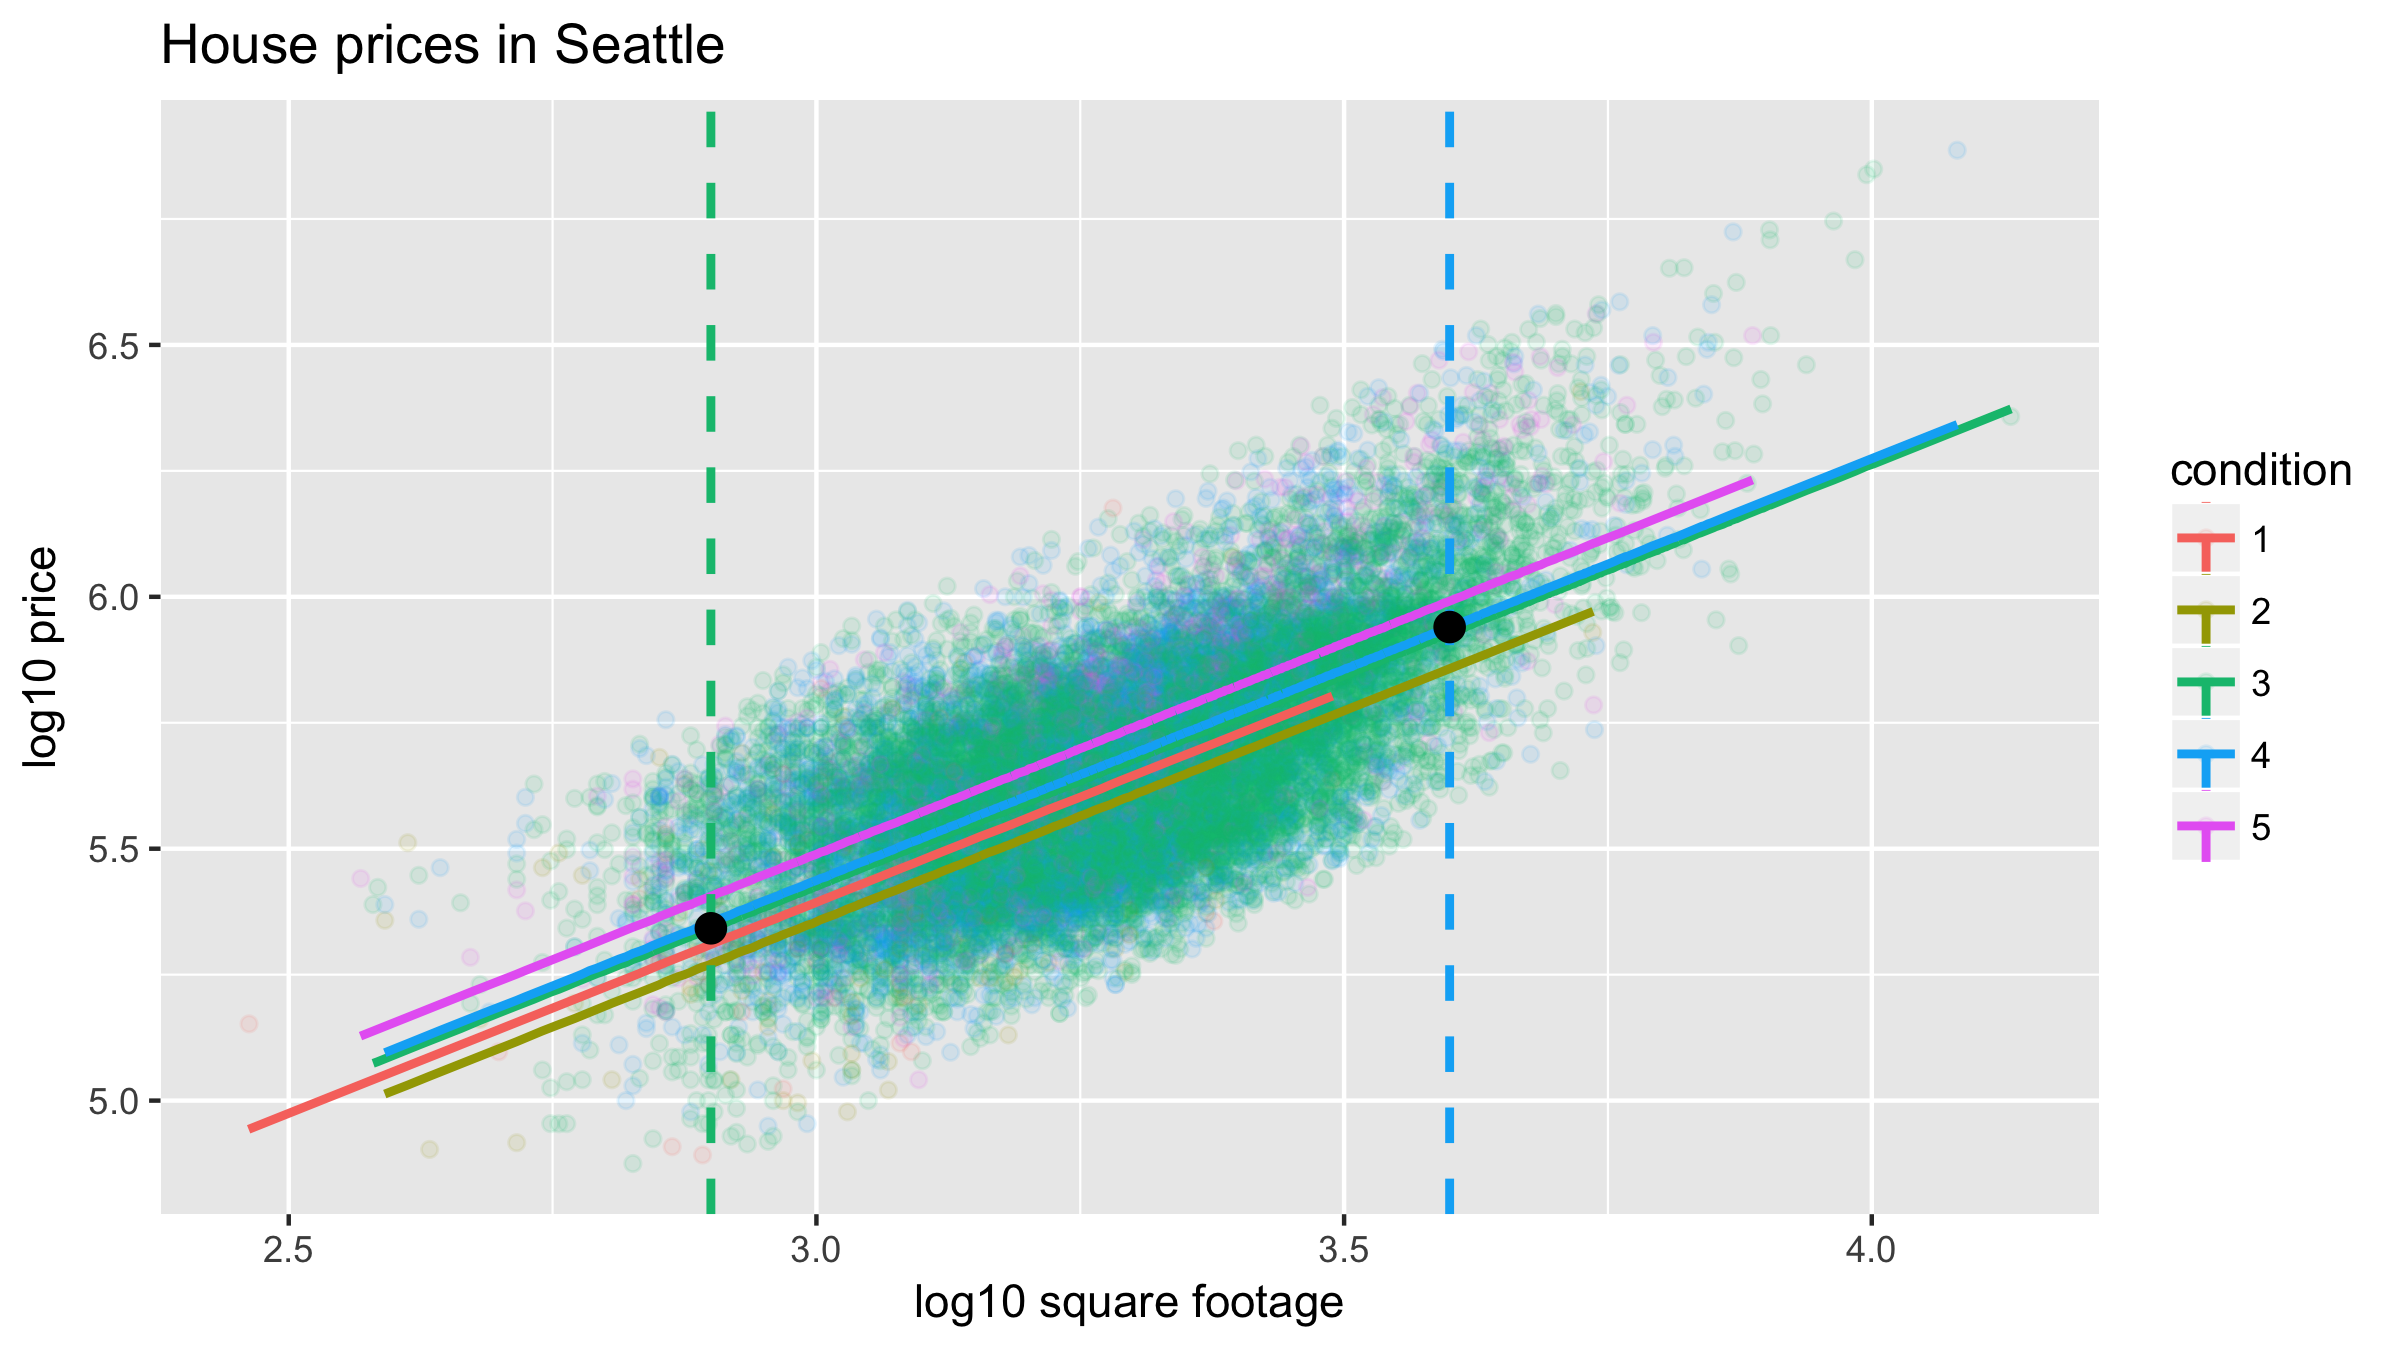
Making a prediction

Visualizing predictions
Modeling with Data in the Tidyverse
Albert Y. Kim
Assistant Professor of Statistical and Data Sciences

