Predicting teaching score using gender
Modeling with Data in the Tidyverse

Albert Y. Kim
Assistant Professor of Statistical and Data Sciences
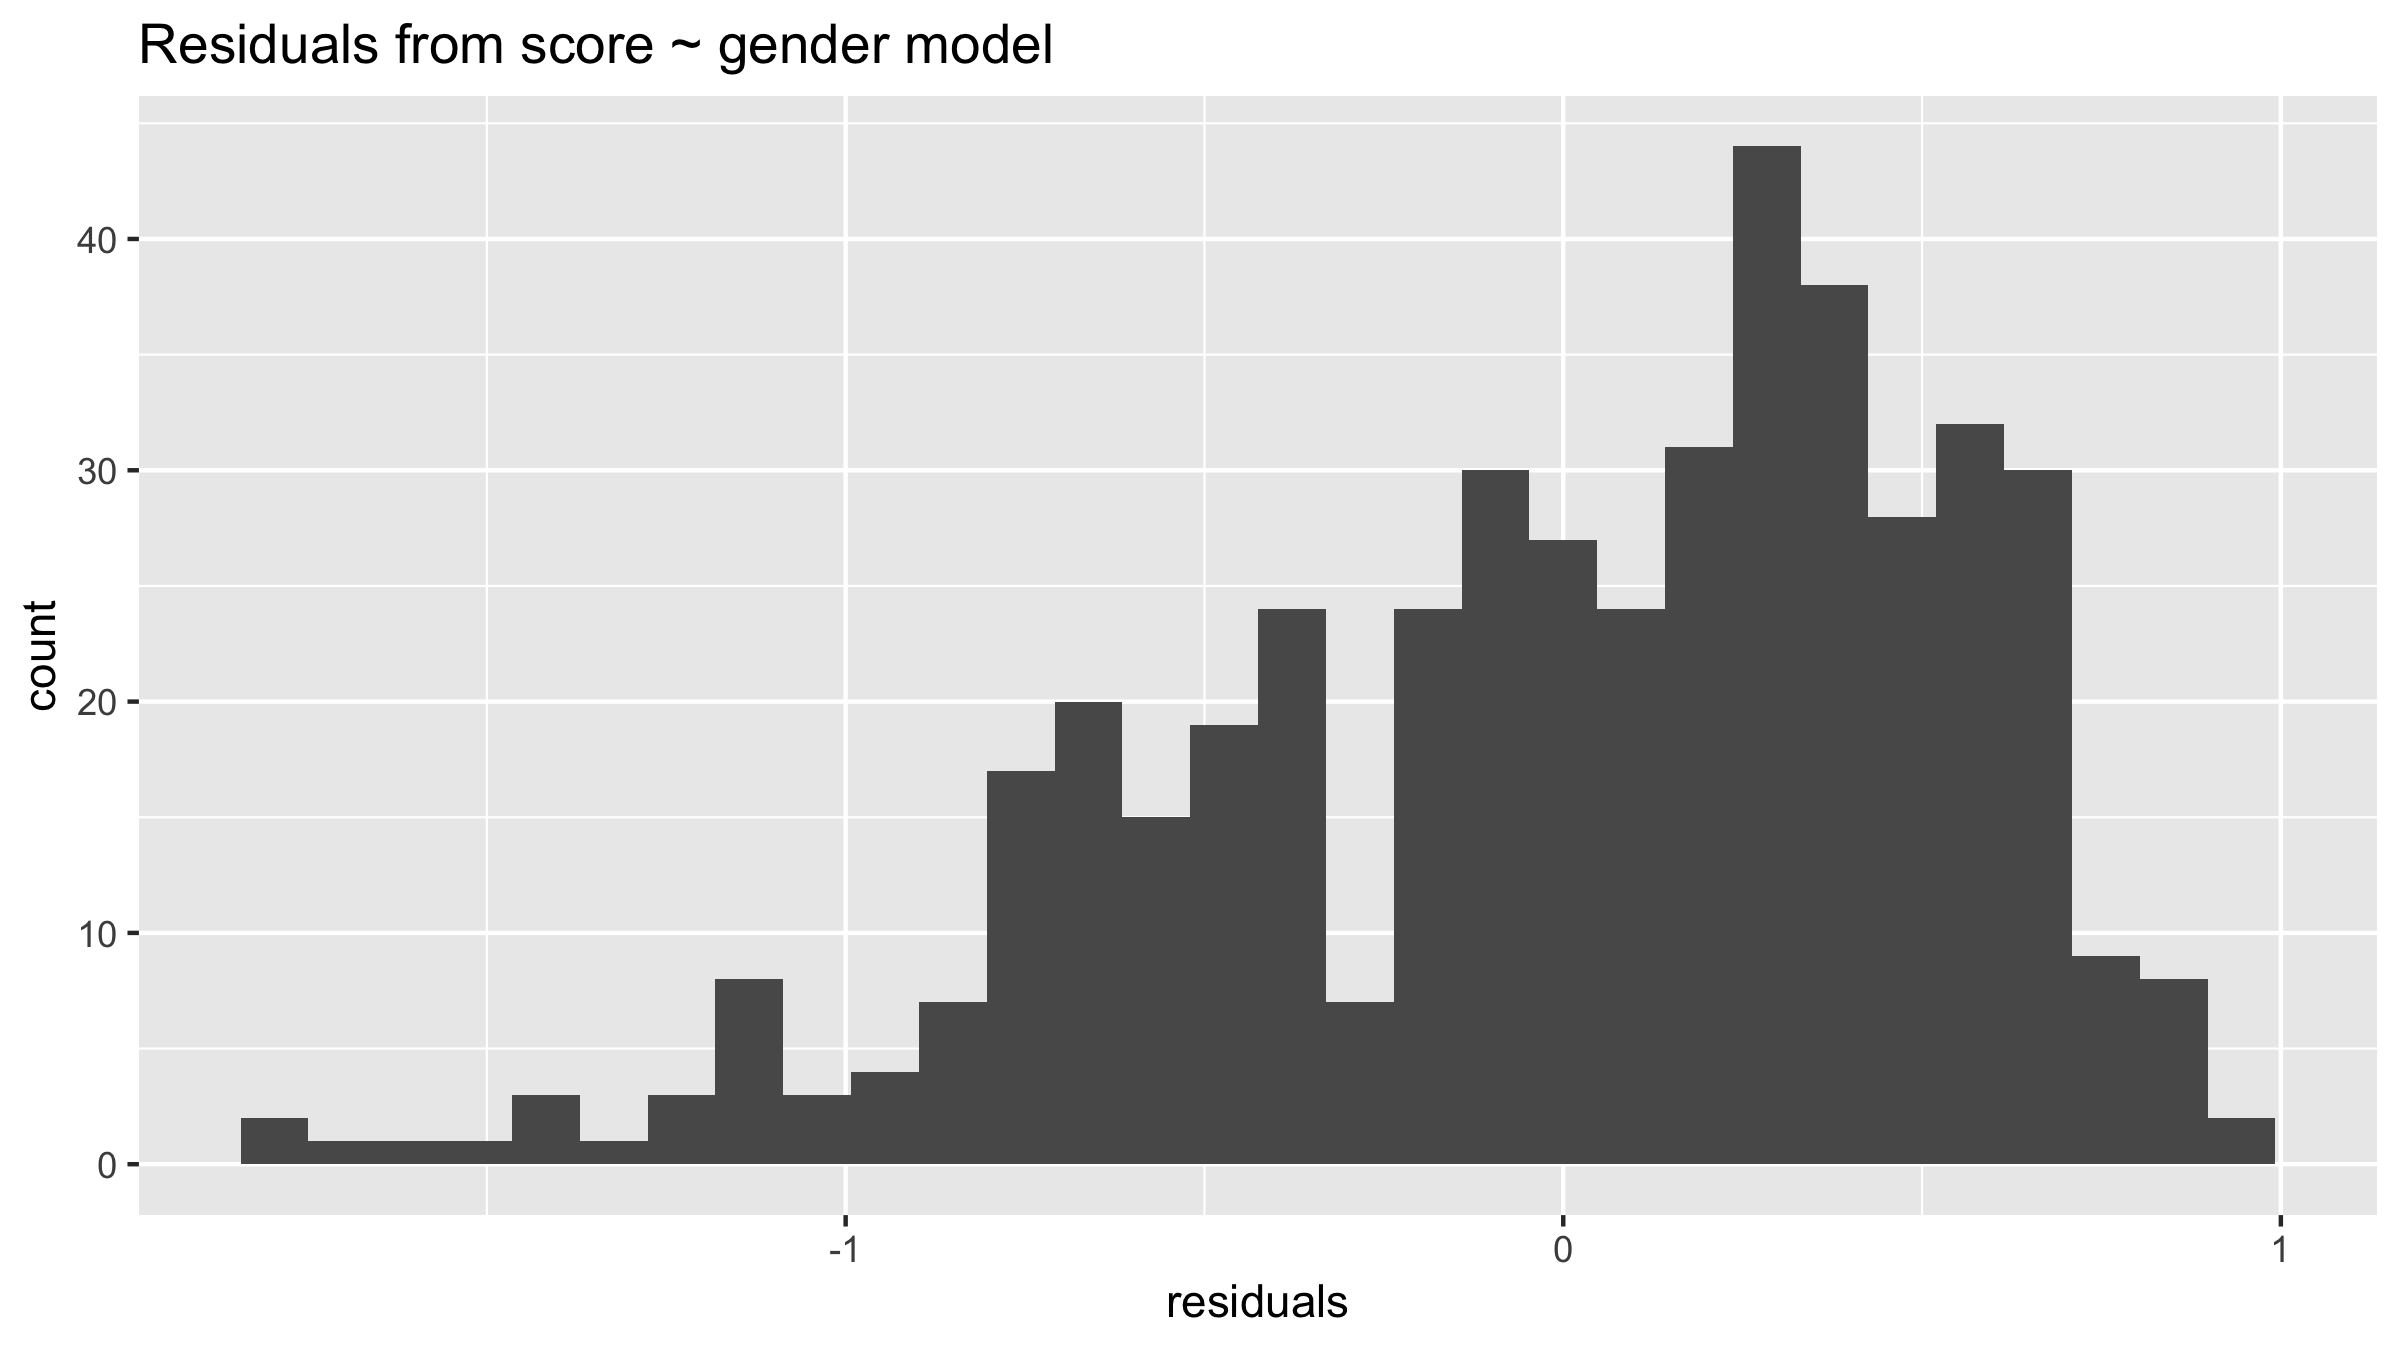
Histogram of residuals
Modeling with Data in the Tidyverse
Albert Y. Kim
Assistant Professor of Statistical and Data Sciences

