एक वैरिएबल का वितरण
R में Exploratory Data Analysis

Andrew Bray
Assistant Professor, Reed College
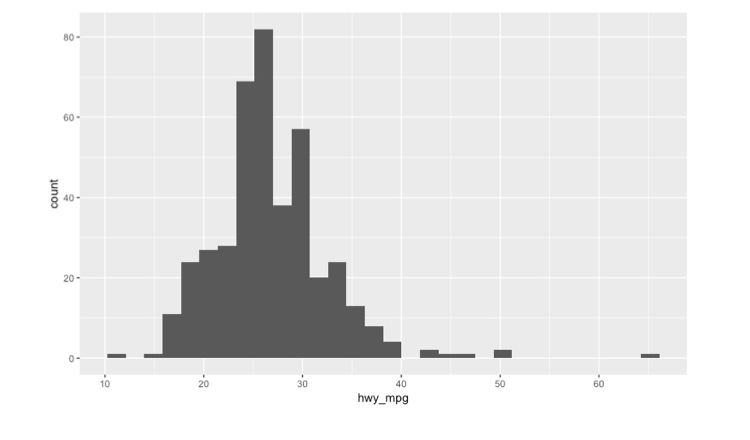
मार्जिनल बनाम कंडीशनल
ggplot(cars, aes(x = hwy_mpg)) +
  geom_histogram()
`stat_bin()` using `bins = 30`. Pick better value with `binwidth`.
Warning message:
Removed 14 rows containing non-finite values (stat_bin).
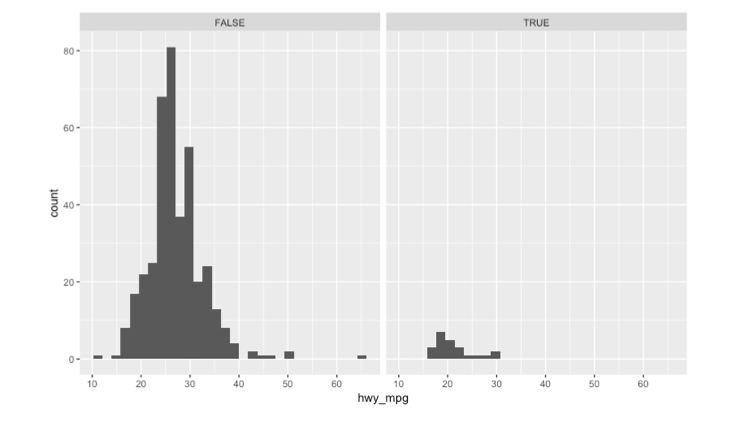
मार्जिनल बनाम कंडीशनल
ggplot(cars, aes(x = hwy_mpg)) +
  geom_histogram() +
  facet_wrap(~pickup)
`stat_bin()` using `bins = 30`. Pick better value with `binwidth`.
Warning message:
Removed 14 rows containing non-finite values (stat_bin).
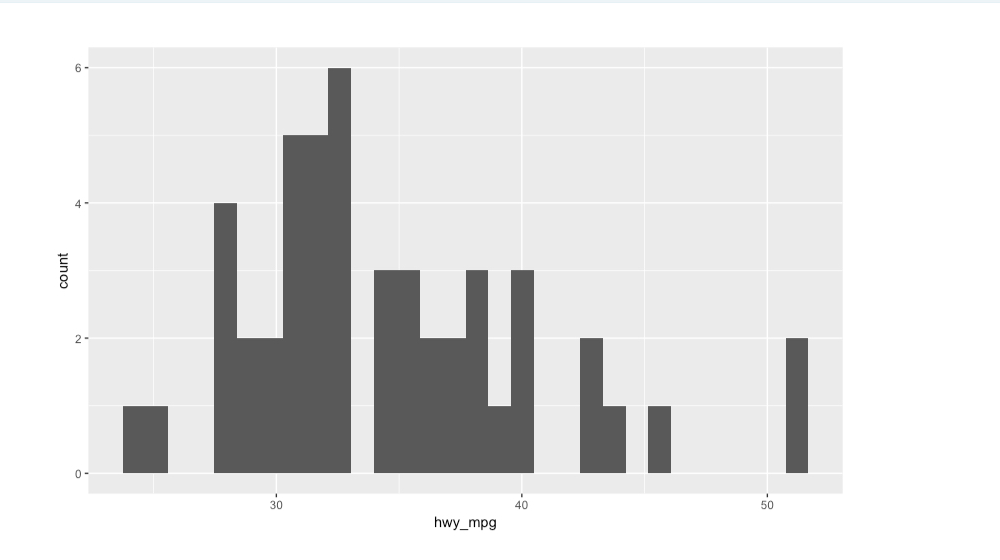
फ़िल्टर किया और फ़ैसटेड हिस्टोग्राम
cars %>%
  filter(eng_size < 2.0) %>%
  ggplot(aes(x = hwy_mpg)) +
  geom_histogram()
`stat_bin()` using `bins = 30`. Pick better value with `binwidth`.
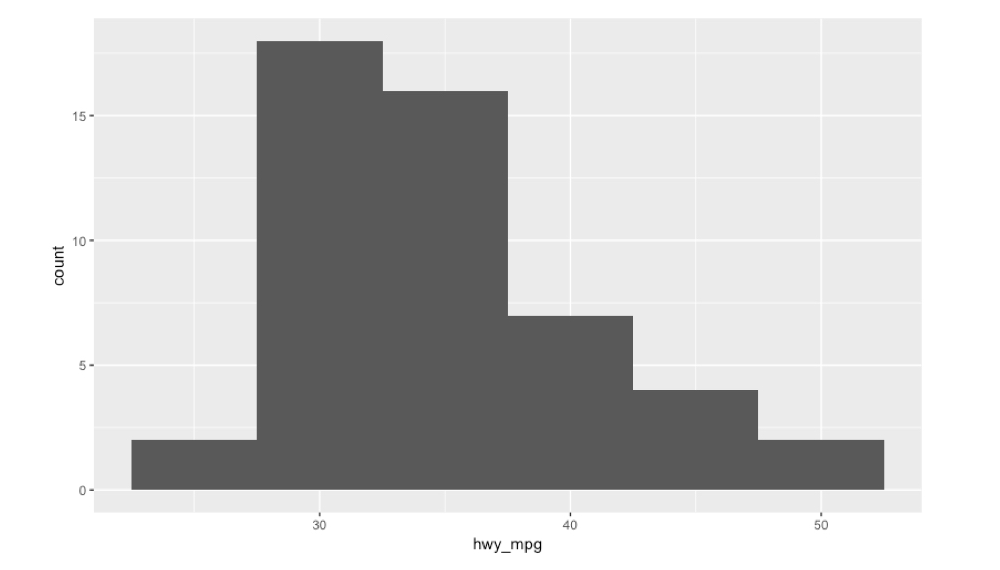
चौड़ा बिन विड्थ
cars %>%
  filter(eng_size < 2.0) %>%
  ggplot(aes(x = hwy_mpg)) +
  geom_histogram(binwidth = 5)
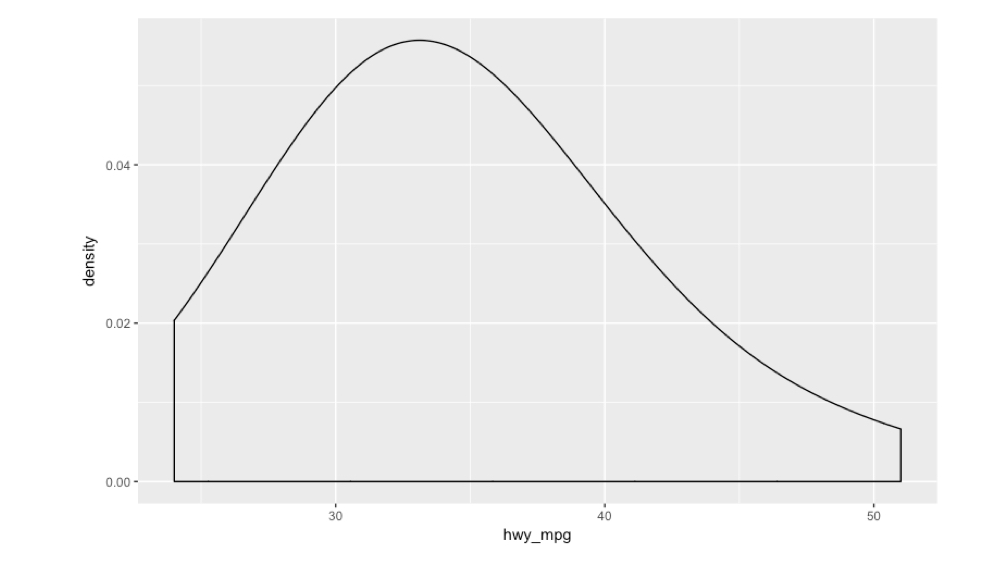
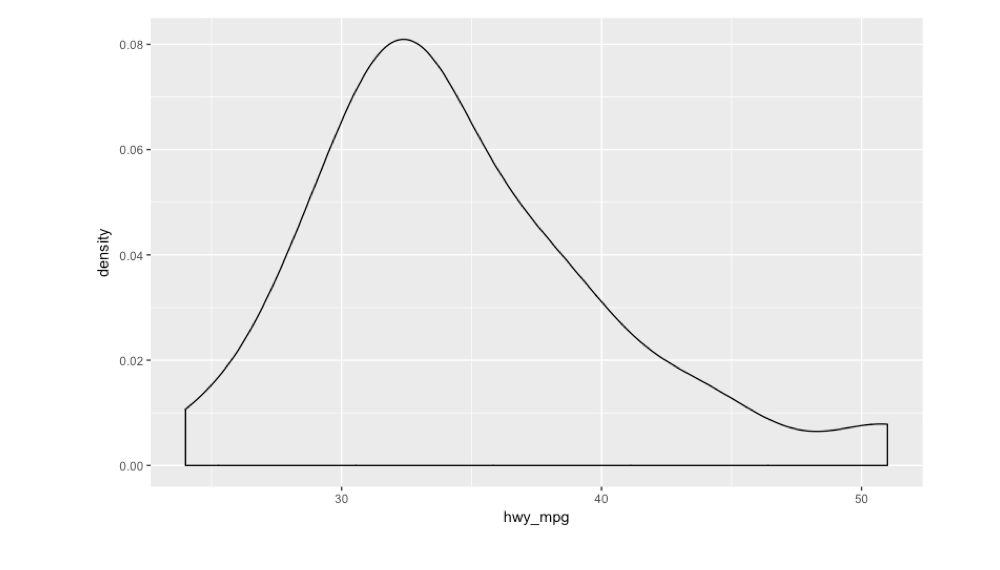
डेंसिटी प्लॉट
cars %>%
  filter(eng_size < 2.0) %>%
  ggplot(aes(x = hwy_mpg)) +
  geom_density()
चौड़ा बैंडविड्थ
cars %>%
  filter(eng_size < 2.0) %>%
  ggplot(aes(x = hwy_mpg)) +
  geom_density(bw = 5)