Normal data

Python में Experimental Design

James Chapman

Curriculum Manager, DataCamp

The normal distribution
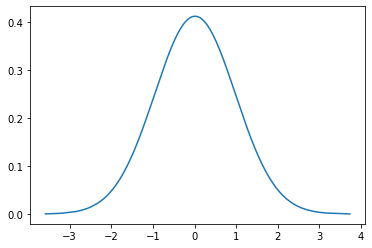
 

  • परिचित 'bell curve' आकार
  • z-score से संबंधित कार्य

$$ {z} = \frac{x-\mu}{\sigma}$$

  • Mean = 0, std = 1
    • 'यह बिंदु mean से कितने standard deviations दूर है?'
    • 'यह score मिलने की probability क्या है?'


डेटा की एक सामान्य bell curve का प्लॉट, सफेद बैकग्राउंड पर नीली bell curve लाइन.

Python में Experimental Design

Normal data and statistical tests


  • Parametric tests के लिए आवश्यक
  • Nonparametric tests: normal data मानकर नहीं चलते


डेटा की एक सामान्य bell curve का प्लॉट, सफेद बैकग्राउंड पर नीली bell curve लाइन.

Python में Experimental Design

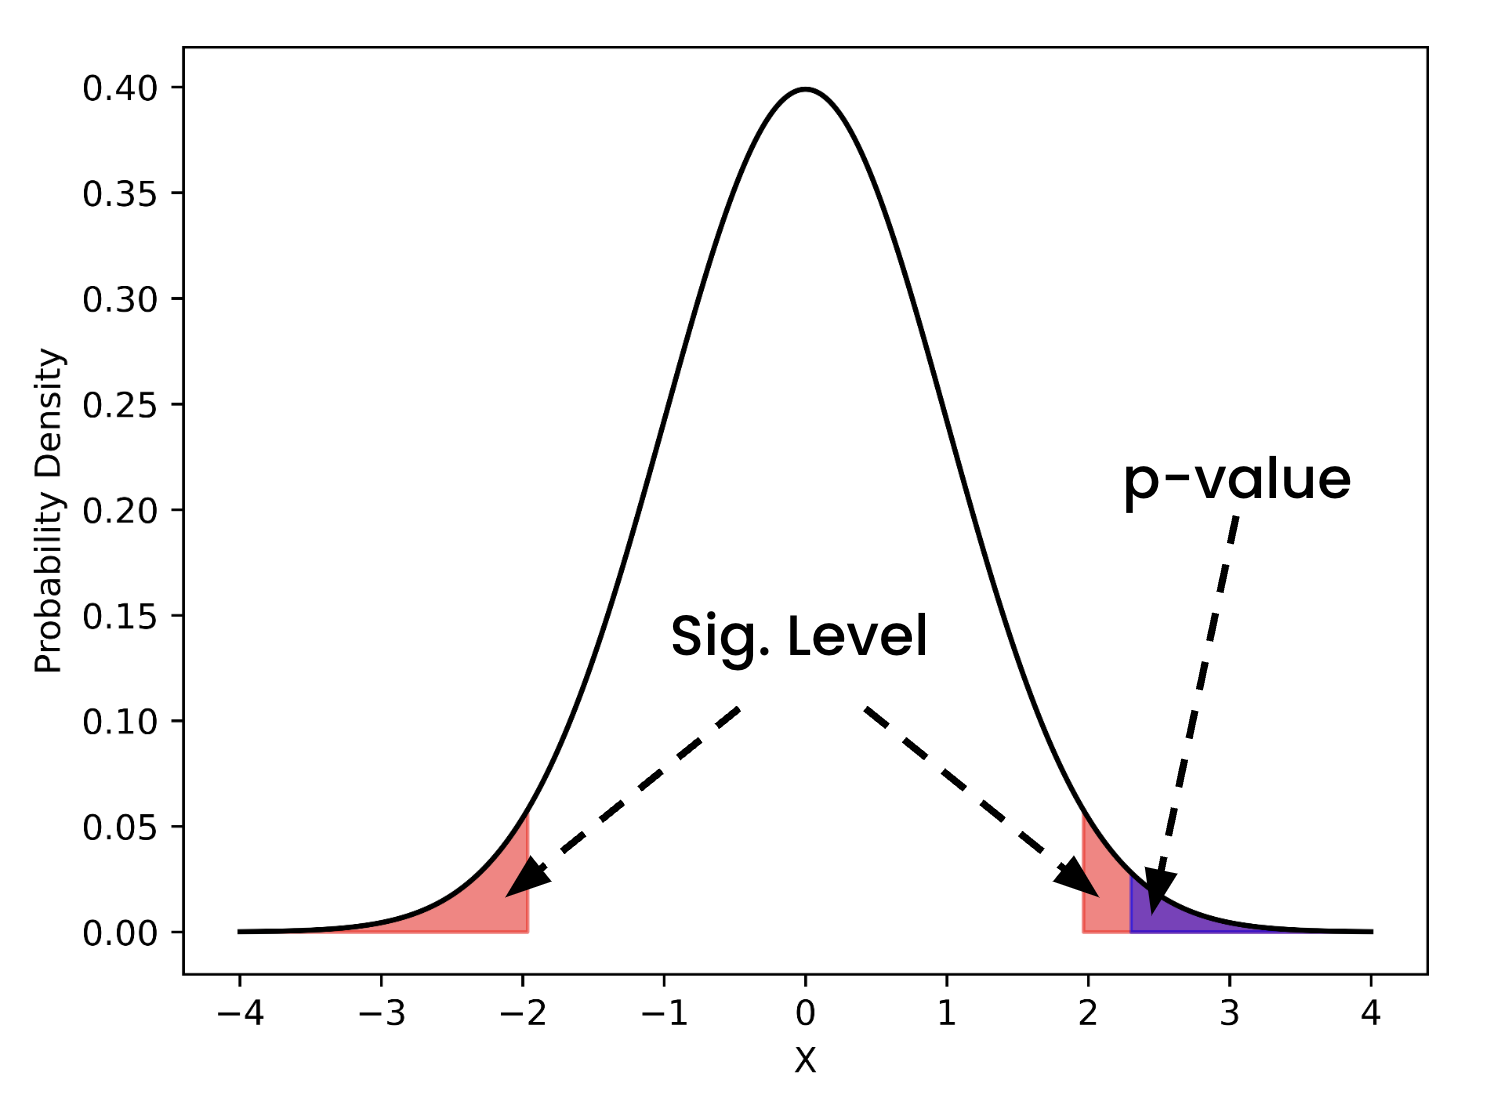
Normal, Z, and alpha


  • significance level ($\alpha$) से महत्वपूर्ण कड़ी
  • p-value को $\alpha$ से तुलना करें
  • Type I error की probability


एक normal distribution जिसकी दोनों tails में छोटे-छोटे काले भरे हुए क्षेत्र दिख रहे हैं

Python में Experimental Design

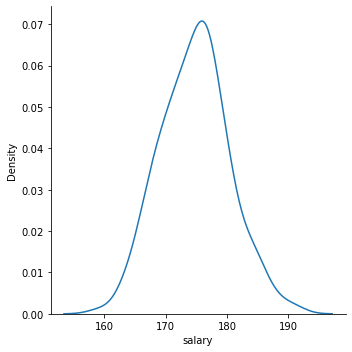
Visualizing normal data


sns.displot(data=salaries,
            x='salary',
            kind="kde")
plt.show()


एक bell curve distribution जो पारंपरिक से ऊँची और कम चौड़ी है, पर सामान्य bell curve आकार बनाए रखती है

Python में Experimental Design

QQ plots

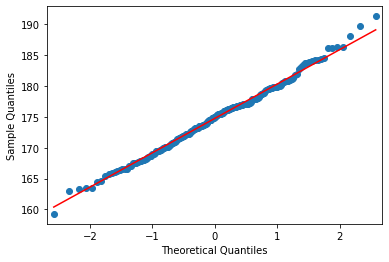
QQ plot: डेटा की किसी खास distribution से तुलना करें

from statsmodels.graphics.gofplots import qqplot
from scipy.stats.distributions import norm
qqplot(salaries['salary'], 
       line='s', 
       dist=norm)
plt.show()
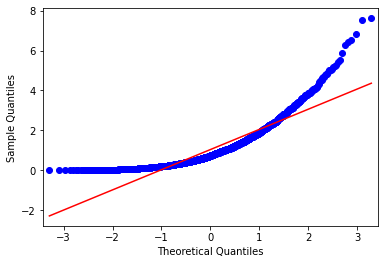
  • आदर्श: बिंदु लाइन से चिपके हों
  • खराब: सिरों पर बाहर की ओर झुके


एक qq plot जहाँ ज़्यादातर बिंदु बीच की 45-डिग्री लाइन से क़रीब-क़रीब चिपके हैं

एक qq plot जहाँ बीच के बिंदु 45-डिग्री लाइन के क़रीब हैं, पर दोनों सिरों पर बिंदु अंदर की ओर झुकते हुए एक मुड़ी हुई रेखा बनाते हैं

Python में Experimental Design

Tests for normality


  • Shapiro-Wilk (छोटे datasets के लिए अच्छा)
  • D'Agostino $K^2$ (kurtosis और skewness उपयोग करता है)
  • Anderson-Darling (values की सूची लौटाता है)


$H_0$ = "Data is drawn from a Normal Distribution"

Python में Experimental Design

A Shapiro-Wilk test


from scipy.stats import shapiro
alpha = 0.05

stat, p = shapiro(salaries['salary']) print(f"p: {round(p,4)} test stat: {round(stat,4)}")
p: 0.8293 test stat: 0.9956
  • p > alpha
    • $H_0$ अस्वीकार करने में विफल → संभवतः normal
Python में Experimental Design

An Anderson-Darling test

from scipy.stats import anderson
result = anderson(x=salaries['salary'], dist="norm")
print(round(result.statistic,4))
print(result.significance_level)
print(result.critical_values)
0.2748
[15.  10.   5.   2.5  1. ]
[0.572 0.651 0.781 0.911 1.084]
  • 0.2748 < [0.572 0.651 0.781 0.911 1.084]
    • $H_0$ अस्वीकार करने में विफल → संभवतः normal
Python में Experimental Design

अभ्यास करते हैं!

Python में Experimental Design

Preparing Video For Download...