Python में फाइनेंशियल ट्रेडिंग
Chelsea Yang
Data Science Instructor
$ RSI = 100 - 100/(1+RS) $
Where:
# Calculate RSI
stock_data['RSI'] = talib.RSI(stock_data['Close'], timeperiod=14)

# Print the last five rows
print(stock_data.tail())
# Calculate RSI stock_data['RSI'] = talib.RSI(stock_data['Close'], timeperiod=14)
# Print the last five rows print(stock_data.tail())
              Open    High     Low   Close   RSI
Date
2020-11-24 1730.50 1771.60 1727.69 1768.88 62.78
2020-11-25 1772.89 1778.54 1756.54 1771.43 63.10
2020-11-27 1773.09 1804.00 1772.44 1793.19 65.81
2020-11-30 1781.18 1788.06 1755.00 1760.74 58.87
2020-12-01 1774.37 1824.83 1769.37 1798.10 63.63
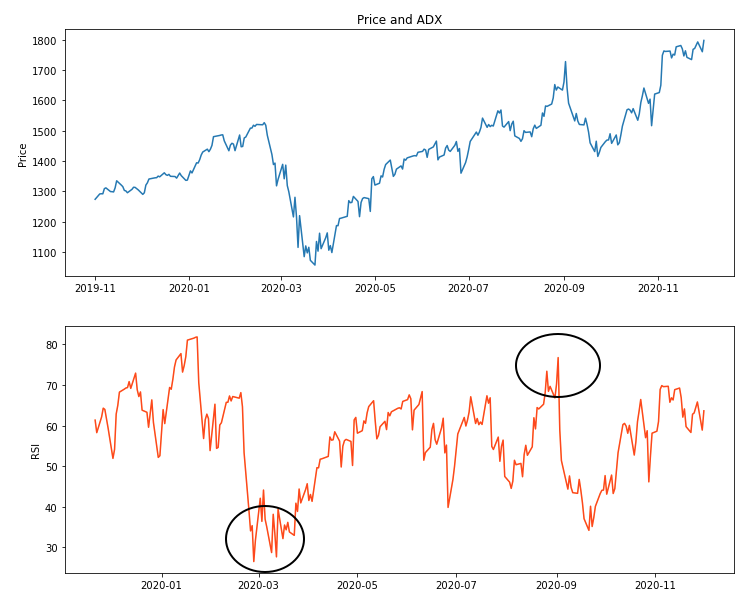
import matplotlib.pyplot as plt

# Create subplots
fig, (ax1, ax2) = plt.subplots(2)


# Plot RSI with the price
ax1.set_ylabel('Price')
ax1.plot(stock_data['Close'])
ax2.set_ylabel('RSI')
ax2.plot(stock_data['RSI'])

ax1.set_title('Price and RSI')
plt.show()
import matplotlib.pyplot as plt # Create subplots fig, (ax1, ax2) = plt.subplots(2)
# Plot RSI with the price ax1.set_ylabel('Price') ax1.plot(stock_data['Close']) ax2.set_ylabel('RSI') ax2.plot(stock_data['RSI']) ax1.set_title('Price and RSI') plt.show()