वोलैटिलिटी इंडिकेटर: Bollinger Bands

Python में फाइनेंशियल ट्रेडिंग

Chelsea Yang

Data Science Instructor

Bollinger Bands क्या हैं?

  • जॉन बोलिंजर द्वारा विकसित

    • "Bollinger on Bollinger Bands"


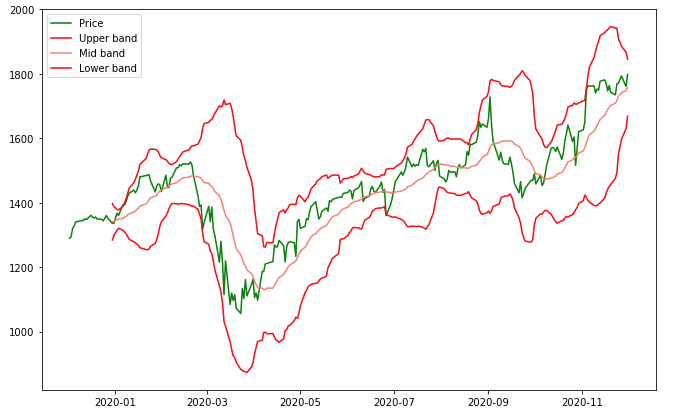
    Bollinger Bands डेमो

  • प्राइस वोलैटिलिटी नापता है
  • तीन लाइनों से बना:
    • मिडिल बैंड: n-पीरियड सिंपल मूविंग एवरेज
    • अपर बैंड: मिडिल बैंड से ऊपर k-स्टैंडर्ड डिविएशंस
    • लोअर बैंड: मिडिल बैंड से नीचे k-स्टैंडर्ड डिविएशंस
Python में फाइनेंशियल ट्रेडिंग

Bollinger Bands के निहितार्थ

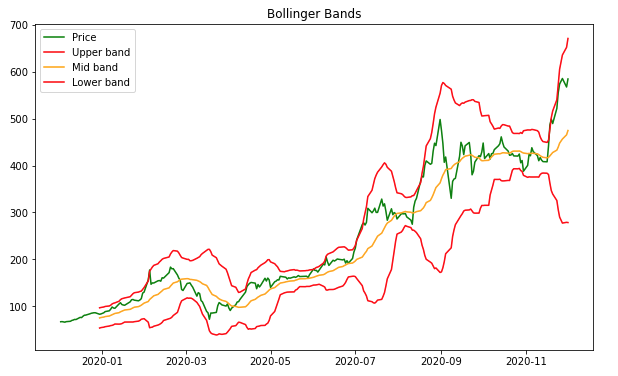
  • बैंड जितने चौड़े, एसेट प्राइस उतने अधिक volatile.


  • सापेक्ष आधार पर प्राइस बहुत ऊँचा या बहुत नीचा है या नहीं, मापें:
    • Relatively high: प्राइस अपर बैंड के पास
    • Relatively low: प्राइस लोअर बैंड के पास
Python में फाइनेंशियल ट्रेडिंग

Python में Bollinger Bands इम्प्लिमेंट करना

# Define the Bollinger Bands
upper, mid, lower = talib.BBANDS(stock_data['Close'],
                                 nbdevup=2,
                                 nbdevdn=2,
                                 timeperiod=20)
Python में फाइनेंशियल ट्रेडिंग

Bollinger Bands प्लॉट करना

import matplotlib.pyplot as plt

# Plot the Bollinger Bands 
plt.plot(stock_data['Close'], label='Price')
plt.plot(upper, label="Upper band")
plt.plot(mid, label='Middle band')
plt.plot(lower, label='Lower band')


# Customize and show the plot plt.title('Bollinger Bands') plt.legend() plt.show()

Bollinger Bands प्लॉट

Python में फाइनेंशियल ट्रेडिंग

अभ्यास करते हैं!

Python में फाइनेंशियल ट्रेडिंग

Preparing Video For Download...