समय के साथ डेटा की भविष्यवाणी

Python में Time Series Data के लिए Machine Learning

Chris Holdgraf

Fellow, Berkeley Institute for Data Science

क्लासिफिकेशन बनाम रिग्रेशन

क्लासिफिकेशन
classification_model.predict(X_test)
array([0, 1, 1, 0])
रिग्रेशन
regression_model.predict(X_test)
array([0.2, 1.4, 3.6, 0.6])
Python में Time Series Data के लिए Machine Learning

कोरिलेशन और रिग्रेशन

  • रिग्रेशन सहसंबंध जैसा है, पर कुछ मुख्य फर्क हैं
    • Regression: एक प्रक्रिया जो डेटा का औपचारिक मॉडल बनाती है
    • Correlation: डेटा का वर्णन करने वाला सांख्यिकीय मान. रिग्रेशन मॉडल से कम जानकारी देता है.
Python में Time Series Data के लिए Machine Learning

वैरिएबल्स के बीच कोरिलेशन समय के साथ बदलता है

  • टाइमसीरीज़ में पैटर्न समय के साथ बदलते हैं
  • जो दो टाइमसीरीज़ किसी क्षण सहसंबंधित लगें, वे आगे वैसी न रहें
Python में Time Series Data के लिए Machine Learning

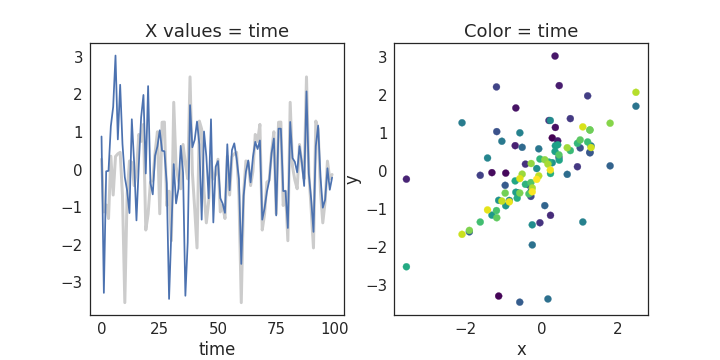
टाइमसीरीज़ के बीच संबंधों का विज़ुअलाइज़ेशन

fig, axs = plt.subplots(1, 2)

# Make a line plot for each timeseries
axs[0].plot(x, c='k', lw=3, alpha=.2)
axs[0].plot(y)
axs[0].set(xlabel='time', title='X values = time')

# Encode time as color in a scatterplot
axs[1].scatter(x_long, y_long, c=np.arange(len(x_long)), cmap='viridis')
axs[1].set(xlabel='x', ylabel='y', title='Color = time')
Python में Time Series Data के लिए Machine Learning

दो टाइमसीरीज़ का विज़ुअलाइज़ेशन

Python में Time Series Data के लिए Machine Learning

scikit-learn के साथ रिग्रेशन मॉडल

from sklearn.linear_model import LinearRegression
model = LinearRegression()
model.fit(X, y)
model.predict(X)
Python में Time Series Data के लिए Machine Learning

scikit-learn से प्रेडिक्शंस का विज़ुअलाइज़ेशन
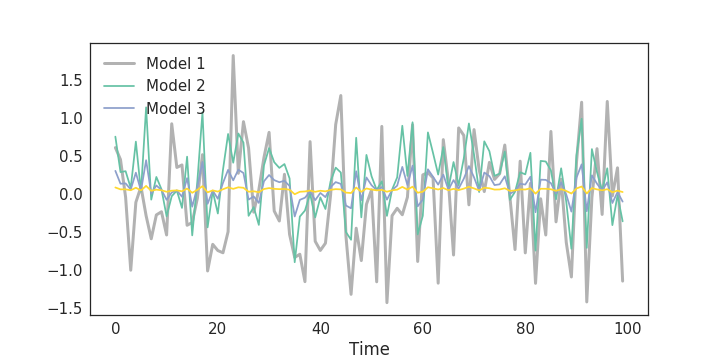
alphas = [.1, 1e2, 1e3]
ax.plot(y_test, color='k', alpha=.3, lw=3)
for ii, alpha in enumerate(alphas):
    y_predicted = Ridge(alpha=alpha).fit(X_train, y_train).predict(X_test)
    ax.plot(y_predicted, c=cmap(ii / len(alphas)))
ax.legend(['True values', 'Model 1', 'Model 2', 'Model 3'])
ax.set(xlabel="Time")
Python में Time Series Data के लिए Machine Learning

scikit-learn से प्रेडिक्शंस का विज़ुअलाइज़ेशन

Python में Time Series Data के लिए Machine Learning

रिग्रेशन मॉडलों की स्कोरिंग

  • दो सबसे आम विधियाँ:
    • Correlation ($r$)
    • Coefficient of Determination ($R^2$)
Python में Time Series Data के लिए Machine Learning

Coefficient of Determination ($R^2$)

  • $R^2$ का अधिकतम मान 1 है, और यह अनंत तक घट सकता है
  • 1 के करीब मान बताता है कि मॉडल आउटपुट बेहतर प्रेडिक्ट करता है

$$ 1 - \frac{error(model)}{variance(testdata)} $$

Python में Time Series Data के लिए Machine Learning

scikit-learn में $R^2$

from sklearn.metrics import r2_score
print(r2_score(y_predicted, y_test))
0.08
Python में Time Series Data के लिए Machine Learning

अभ्यास करते हैं!

Python में Time Series Data के लिए Machine Learning

Preparing Video For Download...