Python में Time Series Data के लिए Machine Learning
Chris Holdgraf
Fellow, Berkeley Institute for Data Science

# कच्चे डेटा को देखें
print(prices.head(3))
symbol AIG ABT
date
2010-01-04 29.889999 54.459951
2010-01-05 29.330000 54.019953
2010-01-06 29.139999 54.319953
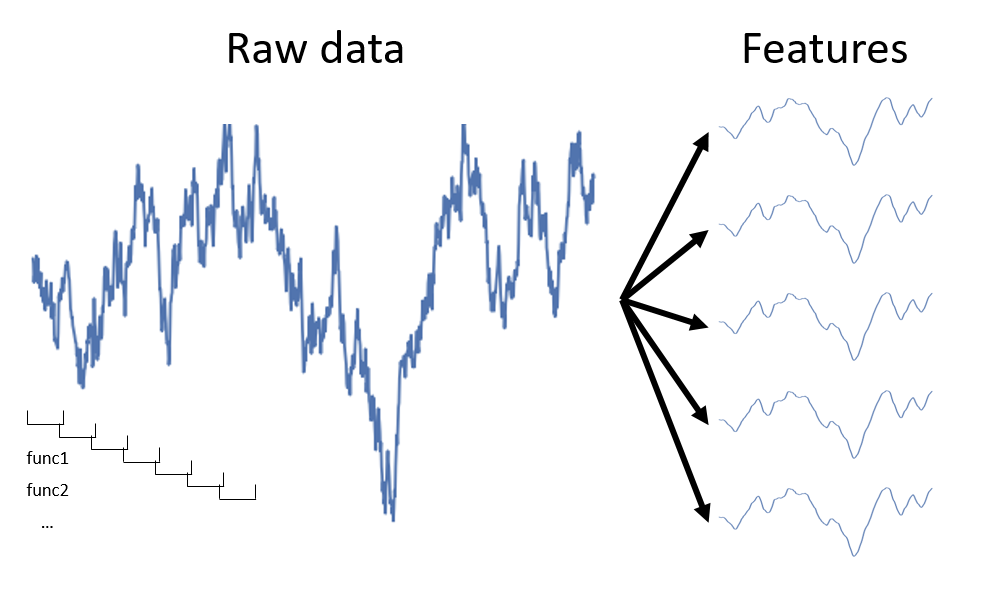
# रोलिंग विंडो निकालें, फिर दो फीचर्स एक्सट्रैक्ट करें
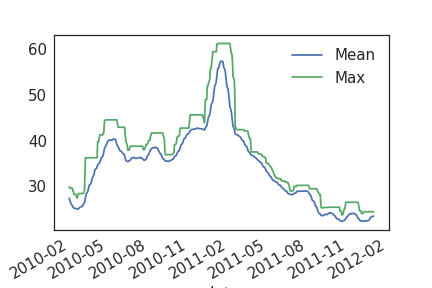
feats = prices.rolling(20).aggregate([np.std, np.max]).dropna()
print(feats.head(3))
AIG ABT
std amax std amax
date
2010-02-01 2.051966 29.889999 0.868830 56.239949
2010-02-02 2.101032 29.629999 0.869197 56.239949
2010-02-03 2.157249 29.629999 0.852509 56.239949

# केवल mean लेने पर एक ही मान मिलता है
a = np.array([[0, 1, 2], [0, 1, 2], [0, 1, 2]])
print(np.mean(a))
1.0
# partial function से np.mean को axis पैरामीटर के साथ इनिशियलाइज़ करें from functools import partial mean_over_first_axis = partial(np.mean, axis=0) print(mean_over_first_axis(a))[0. 1. 2.]
np.mean के बजाय)print(np.percentile(np.linspace(0, 200), q=20))
40.0
data = np.linspace(0, 100)
# लिस्ट कॉम्प्रिहेंशन से फंक्शंस की लिस्ट बनाएँ
percentile_funcs = [partial(np.percentile, q=ii) for ii in [20, 40, 60]]
# हर फंक्शन का आउटपुट एक ही तरह से निकालें
percentiles = [i_func(data) for i_func in percentile_funcs]
print(percentiles)
[20.0, 40.00000000000001, 60.0]
# रोलिंग विंडो के कई percentiles निकालें
data.rolling(20).aggregate(percentiles)
# सुनिश्चित करें कि index datetime है
prices.index = pd.to_datetime(prices.index)
# datetime फीचर्स निकालें
day_of_week_num = prices.index.weekday
print(day_of_week_num[:10])
Index([0 1 2 3 4 0 1 2 3 4], dtype='object')
day_of_week = prices.index.day_name()
print(day_of_week[:10])
Index(['Monday' 'Tuesday' 'Wednesday' 'Thursday' 'Friday' 'Monday' 'Tuesday'
'Wednesday' 'Thursday' 'Friday'], dtype='object')
Python में Time Series Data के लिए Machine Learning