अपने डेटा को साफ़ करें और बेहतर बनाएँ

Python में Time Series Data के लिए Machine Learning

Chris Holdgraf

Fellow, Berkeley Institute for Data Science

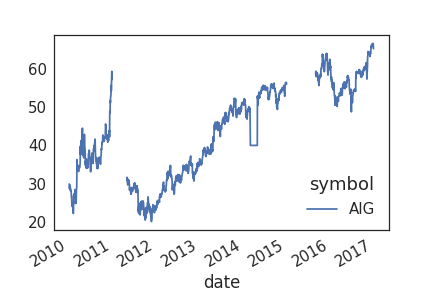
Data मैला होता है

  • रियल-वर्ल्ड डेटा अक्सर मैला होता है
  • दो सबसे आम समस्याएँ हैं missing data और outliers
  • यह अक्सर मानव गलती, मशीन सेंसर खराबी, डेटाबेस फेलियर आदि से होता है
  • रॉ डेटा को विज़ुअलाइज़ करने से इन्हें पहचानना आसान होता है
Python में Time Series Data के लिए Machine Learning

मैला डेटा कैसा दिखता है

Python में Time Series Data के लिए Machine Learning

Interpolation: समय से missing data भरना

  • missing data से निपटने का एक आम तरीका है missing values को interpolate करना
  • टाइमसीरीज़ डेटा में आप interpolation के लिए समय का उपयोग कर सकते हैं.
  • यहाँ interpolation का मतलब है गैप के दोनों ओर के known मानों के आधार पर missing हिस्से का अनुमान लगाना.
Python में Time Series Data के लिए Machine Learning

Pandas में interpolation

# Return a boolean that notes where missing values are
missing = prices.isna()

# Interpolate linearly within missing windows
prices_interp = prices.interpolate('linear')

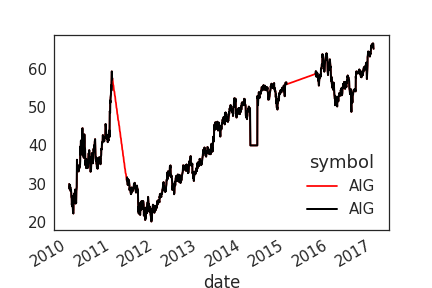
# Plot the interpolated data in red and the data w/ missing values in black
ax = prices_interp.plot(c='r')
prices.plot(c='k', ax=ax, lw=2)
Python में Time Series Data के लिए Machine Learning

Interpolated डेटा का विज़ुअलाइज़ेशन

Python में Time Series Data के लिए Machine Learning

Rolling window से डेटा ट्रांसफॉर्म करना

  • rolling windows का एक और उपयोग है डेटा को ट्रांसफॉर्म करना
  • हम यह पहले भी कर चुके हैं, डेटा को smooth करने के लिए
  • इससे आप और जटिल ट्रांसफॉर्मेशन भी कर सकते हैं
Python में Time Series Data के लिए Machine Learning

Variance मानकीकृत करने के लिए ट्रांसफॉर्म करना

  • एक आम ट्रांसफॉर्मेशन है समय के साथ mean और variance को मानकीकृत करना. इसे कई तरीकों से किया जा सकता है.
  • यहाँ, हम दिखाएँगे कि हर पॉइंट को पिछली विंडो के मुकाबले % change में कैसे बदलें.
  • जब absolute values बहुत बदलते हैं तो यह timepoints को अधिक तुलनीय बनाता है
Python में Time Series Data के लिए Machine Learning

Pandas से percent change में ट्रांसफॉर्म करना

def percent_change(values):
    """Calculates the % change between the last value 
    and the mean of previous values"""
    # Separate the last value and all previous values into variables
    previous_values = values[:-1]
    last_value = values[-1]

    # Calculate the % difference between the last value 
    # and the mean of earlier values
    percent_change = (last_value - np.mean(previous_values)) \
    / np.mean(previous_values)
    return percent_change
Python में Time Series Data के लिए Machine Learning

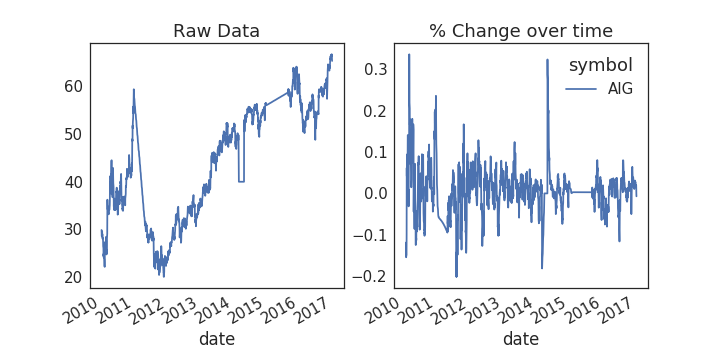
इसे अपने डेटा पर लागू करना

# Plot the raw data
fig, axs = plt.subplots(1, 2, figsize=(10, 5))
ax = prices.plot(ax=axs[0])

# Calculate % change and plot
ax = prices.rolling(window=20).aggregate(percent_change).plot(ax=axs[1])
ax.legend_.set_visible(False)
Python में Time Series Data के लिए Machine Learning

अपने डेटा में outliers ढूँढना

  • Outliers वे datapoints हैं जो डेटासेट से सांख्यिकीय रूप से काफी अलग हों.
  • ये आपके मॉडल की predictive power को नुकसान पहुँचा सकते हैं, इसे उसके "true" मान से भटका सकते हैं
  • एक समाधान है outliers को हटाना या किसी अधिक प्रतिनिधि मान से बदलना

बहुत सावधानी रखें - वैध अत्यधिक मान और गलती/विक्षेप में फर्क करना अक्सर कठिन होता है

Python में Time Series Data के लिए Machine Learning

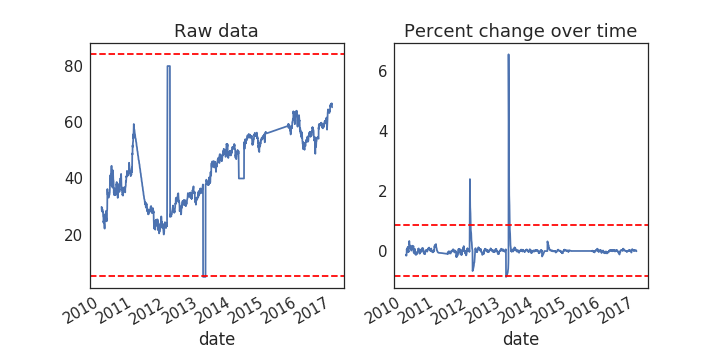
डेटा पर threshold प्लॉट करना

fig, axs = plt.subplots(1, 2, figsize=(10, 5))
for data, ax in zip([prices, prices_perc_change], axs):
    # Calculate the mean / standard deviation for the data
    this_mean = data.mean()
    this_std = data.std()

    # Plot the data, with a window that is 3 standard deviations 
    # around the mean
    data.plot(ax=ax)
    ax.axhline(this_mean + this_std * 3, ls='--', c='r')
    ax.axhline(this_mean - this_std * 3, ls='--', c='r')
Python में Time Series Data के लिए Machine Learning

Outlier thresholds का विज़ुअलाइज़ेशन

Python में Time Series Data के लिए Machine Learning

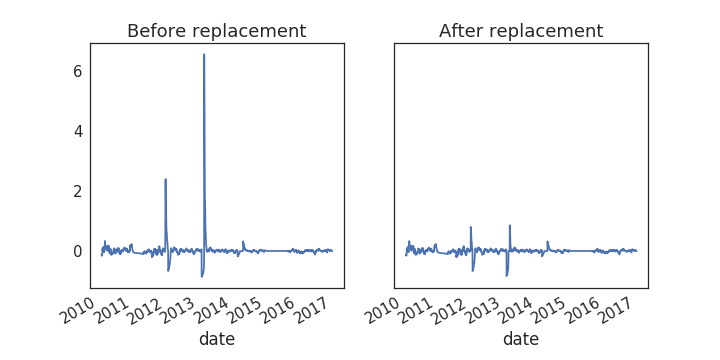
Threshold से outliers बदलना

# Center the data so the mean is 0
prices_outlier_centered = prices_outlier_perc - prices_outlier_perc.mean()

# Calculate standard deviation
std = prices_outlier_perc.std()

# Use the absolute value of each datapoint 
# to make it easier to find outliers
outliers = np.abs(prices_outlier_centered) > (std * 3)

# Replace outliers with the median value
# We'll use np.nanmean since there may be nans around the outliers
prices_outlier_fixed = prices_outlier_centered.copy()
prices_outlier_fixed[outliers] = np.nanmedian(prices_outlier_fixed)

Python में Time Series Data के लिए Machine Learning

परिणामों का विज़ुअलाइज़ेशन

fig, axs = plt.subplots(1, 2, figsize=(10, 5))
prices_outlier_centered.plot(ax=axs[0])
prices_outlier_fixed.plot(ax=axs[1])
Python में Time Series Data के लिए Machine Learning

अभ्यास करते हैं!

Python में Time Series Data के लिए Machine Learning

Preparing Video For Download...