Stationarity और stability

Python में Time Series Data के लिए Machine Learning

Chris Holdgraf

Fellow, Berkeley Institute for Data Science
Stationarity

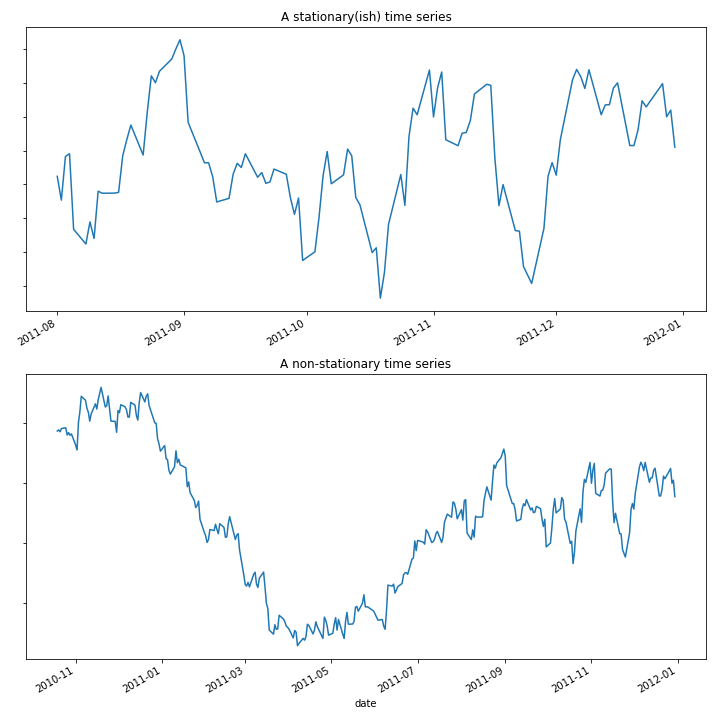
  • Stationary time series की सांख्यिकी गुण समय के साथ नहीं बदलते
  • जैसे, mean, standard deviation, trends
  • ज़्यादातर time series किसी न किसी स्तर पर non-stationary होती हैं
Python में Time Series Data के लिए Machine Learning

Python में Time Series Data के लिए Machine Learning

Model stability

  • Non-stationary डेटा हमारे मॉडल में variability लाता है
  • मॉडल द्वारा पाए गए सांख्यिकी गुण डेटा के साथ बदल सकते हैं
  • साथ ही, मॉडल पैरामीटर के सही मानों पर हमारी निश्चितता घटेगी
  • इसे हम कैसे मापें?
Python में Time Series Data के लिए Machine Learning

पैरामीटर stability मापने के लिए cross validation

  • एक तरीका: cross-validation का उपयोग करें
  • हर iteration पर मॉडल पैरामीटर निकालें
  • सभी CV splits में पैरामीटर stability आँकें
Python में Time Series Data के लिए Machine Learning

Bootstrapping the mean

  • Variability आँकने का एक आम तरीका bootstrapping है
  • Bootstrap:
    1. डेटा का random sample with replacement लें
    2. sample का mean निकालें
    3. इस प्रक्रिया को कई बार दोहराएँ (1000s)
    4. परिणाम के percentiles निकालें (आम तौर पर 2.5, 97.5)

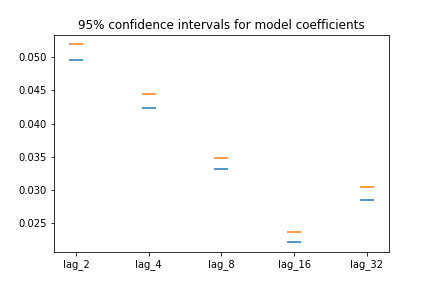
परिणाम mean के लिए हर coefficient का 95% confidence interval होता है.

Python में Time Series Data के लिए Machine Learning

Bootstrapping the mean

from sklearn.utils import resample

# cv_coefficients has shape (n_cv_folds, n_coefficients)
n_boots = 100
bootstrap_means = np.zeros(n_boots, n_coefficients)
for ii in range(n_boots):
    # Generate random indices for our data with replacement, 
    # then take the sample mean
    random_sample = resample(cv_coefficients)
    bootstrap_means[ii] = random_sample.mean(axis=0)

# Compute the percentiles of choice for the bootstrapped means
percentiles = np.percentile(bootstrap_means, (2.5, 97.5), axis=0)
Python में Time Series Data के लिए Machine Learning

Bootstrapped coefficients का plot

fig, ax = plt.subplots()
ax.scatter(many_shifts.columns, percentiles[0], marker='_', s=200)
ax.scatter(many_shifts.columns, percentiles[1], marker='_', s=200)
Python में Time Series Data के लिए Machine Learning

Model performance stability का आकलन

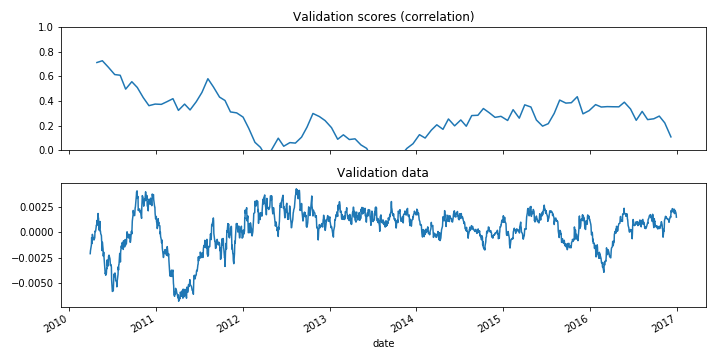
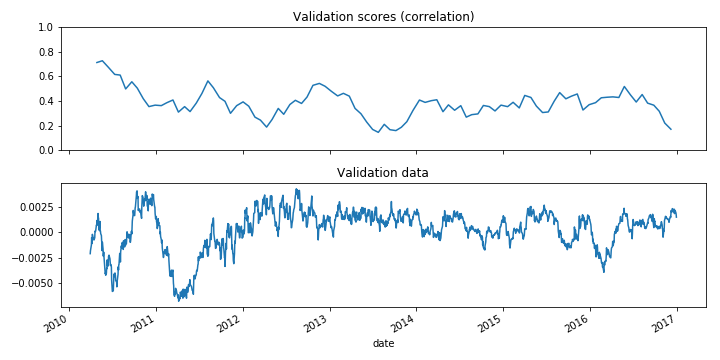
  • यदि TimeSeriesSplit का उपयोग करें, तो समय के साथ मॉडल का स्कोर plot कर सकते हैं.
  • यह उन समय-क्षेत्रों को ढूँढने में सहायक है जो स्कोर घटाते हैं
  • Non-stationary signals खोजने में भी उपयोगी
Python में Time Series Data के लिए Machine Learning

समय के साथ model performance

def my_corrcoef(est, X, y):
    """Return the correlation coefficient 
    between model predictions and a validation set."""
    return np.corrcoef(y, est.predict(X))[1, 0]

# Grab the date of the first index of each validation set
first_indices = [data.index[tt[0]] for tr, tt in cv.split(X, y)]

# Calculate the CV scores and convert to a Pandas Series
cv_scores = cross_val_score(model, X, y, cv=cv, scoring=my_corrcoef)
cv_scores = pd.Series(cv_scores, index=first_indices)
Python में Time Series Data के लिए Machine Learning

Model scores को time series की तरह visualize करना

fig, axs = plt.subplots(2, 1, figsize=(10, 5), sharex=True)

# Calculate a rolling mean of scores over time
cv_scores_mean = cv_scores.rolling(10, min_periods=1).mean()
cv_scores.plot(ax=axs[0])
axs[0].set(title='Validation scores (correlation)', ylim=[0, 1])

# Plot the raw data
data.plot(ax=axs[1])
axs[1].set(title='Validation data')
Python में Time Series Data के लिए Machine Learning

Model scores का visualization

Python में Time Series Data के लिए Machine Learning

Time series cross-validation में fixed windows

# Only keep the last 100 datapoints in the training data
window = 100

# Initialize the CV with this window size
cv = TimeSeriesSplit(n_splits=10, max_train_size=window)
Python में Time Series Data के लिए Machine Learning

Non-stationary signals

Python में Time Series Data के लिए Machine Learning

अभ्यास करते हैं!

Python में Time Series Data के लिए Machine Learning

Preparing Video For Download...