डेटा का प्लॉटिंग

इंटरमीडिएट Python फॉर फाइनेंस

Kennedy Behrman

Data Engineer, Author, Founder

अपना डेटा देखें

स्टॉक कीमतों का प्लॉट

इंटरमीडिएट Python फॉर फाइनेंस
exxon.head()
इंटरमीडिएट Python फॉर फाइनेंस

डेटा का परिचय

exxon.head()
    Date         High        Volume      Month
0   2015-05-01   90.089996   198924100   May
1   2015-06-01   85.970001   238808600   Jun
2   2015-07-01   83.529999   274029000   Jul
3   2015-08-01   79.290001   387523600   Aug
4   2015-09-01   75.470001   316644500   Sep

इंटरमीडिएट Python फॉर फाइनेंस

Matplotlib

my_dataframe.plot()
इंटरमीडिएट Python फॉर फाइनेंस

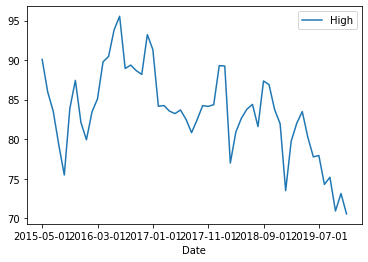
लाइन प्लॉट

exxon.plot(x='Date', 
           y='High' )
इंटरमीडिएट Python फॉर फाइनेंस

स्टॉक कीमतों का लाइन प्लॉट

इंटरमीडिएट Python फॉर फाइनेंस

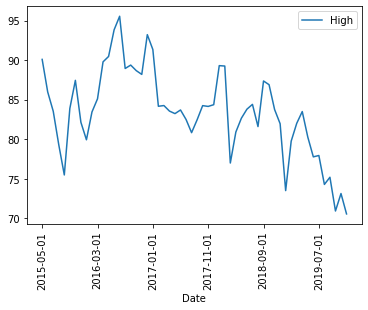
रोटेट

exxon.plot(x='Date', 
           y='High', 
           rot=90 )
इंटरमीडिएट Python फॉर फाइनेंस

घुमाए गए लेबल वाला लाइन प्लॉट

इंटरमीडिएट Python फॉर फाइनेंस

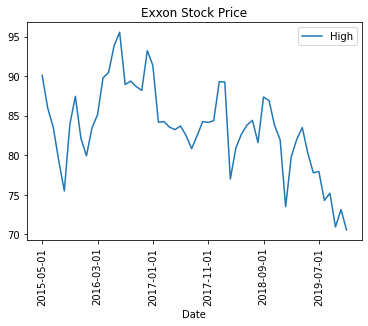
शीर्षक

exxon.plot(x='Date', 
           y='High', 
           rot=90, 
           title='Exxon Stock Price')
इंटरमीडिएट Python फॉर फाइनेंस

शीर्षक सहित लाइन प्लॉट

इंटरमीडिएट Python फॉर फाइनेंस

इंडेक्स

exxon.set_index('Date', inplace=True)
exxon.plot(y='High', 
           rot=90, 
           title='Exxon Stock Price')
इंटरमीडिएट Python फॉर फाइनेंस

x-अक्ष पर इंडेक्स वाला लाइन प्लॉट

इंटरमीडिएट Python फॉर फाइनेंस

प्लॉट प्रकार

  • line
  • bar
  • barh
  • hist
  • box
  • kde
  • density
  • area
  • pie
  • scatter
  • hexbin
इंटरमीडिएट Python फॉर फाइनेंस

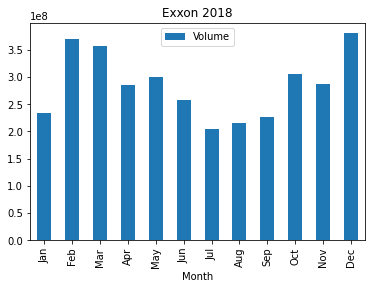
बार

exxon2018.plot(x='Month', 
               y='Volume', 
               kind='bar', 
               title='Exxon 2018')
इंटरमीडिएट Python फॉर फाइनेंस

बार प्लॉट

इंटरमीडिएट Python फॉर फाइनेंस

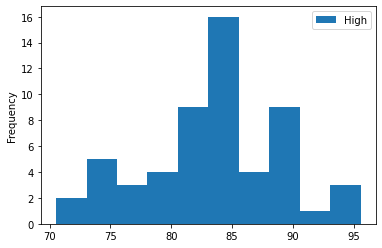
हिस्ट

exxon.plot(y='High',kind='hist')
इंटरमीडिएट Python फॉर फाइनेंस

हिस्टोग्राम

इंटरमीडिएट Python फॉर फाइनेंस

अभ्यास करते हैं!

इंटरमीडिएट Python फॉर फाइनेंस

Preparing Video For Download...