इंटरमीडिएट Data Visualization with ggplot2
Rick Scavetta
Founder, Scavetta Academy
एक-से स्केल न रखने के कारण:
| वैरिएबल टाइप | सबसेट में होता है |
|---|---|
| Continuous | बहुत अलग रेंज |
| Categorical | अलग-अलग समूह |
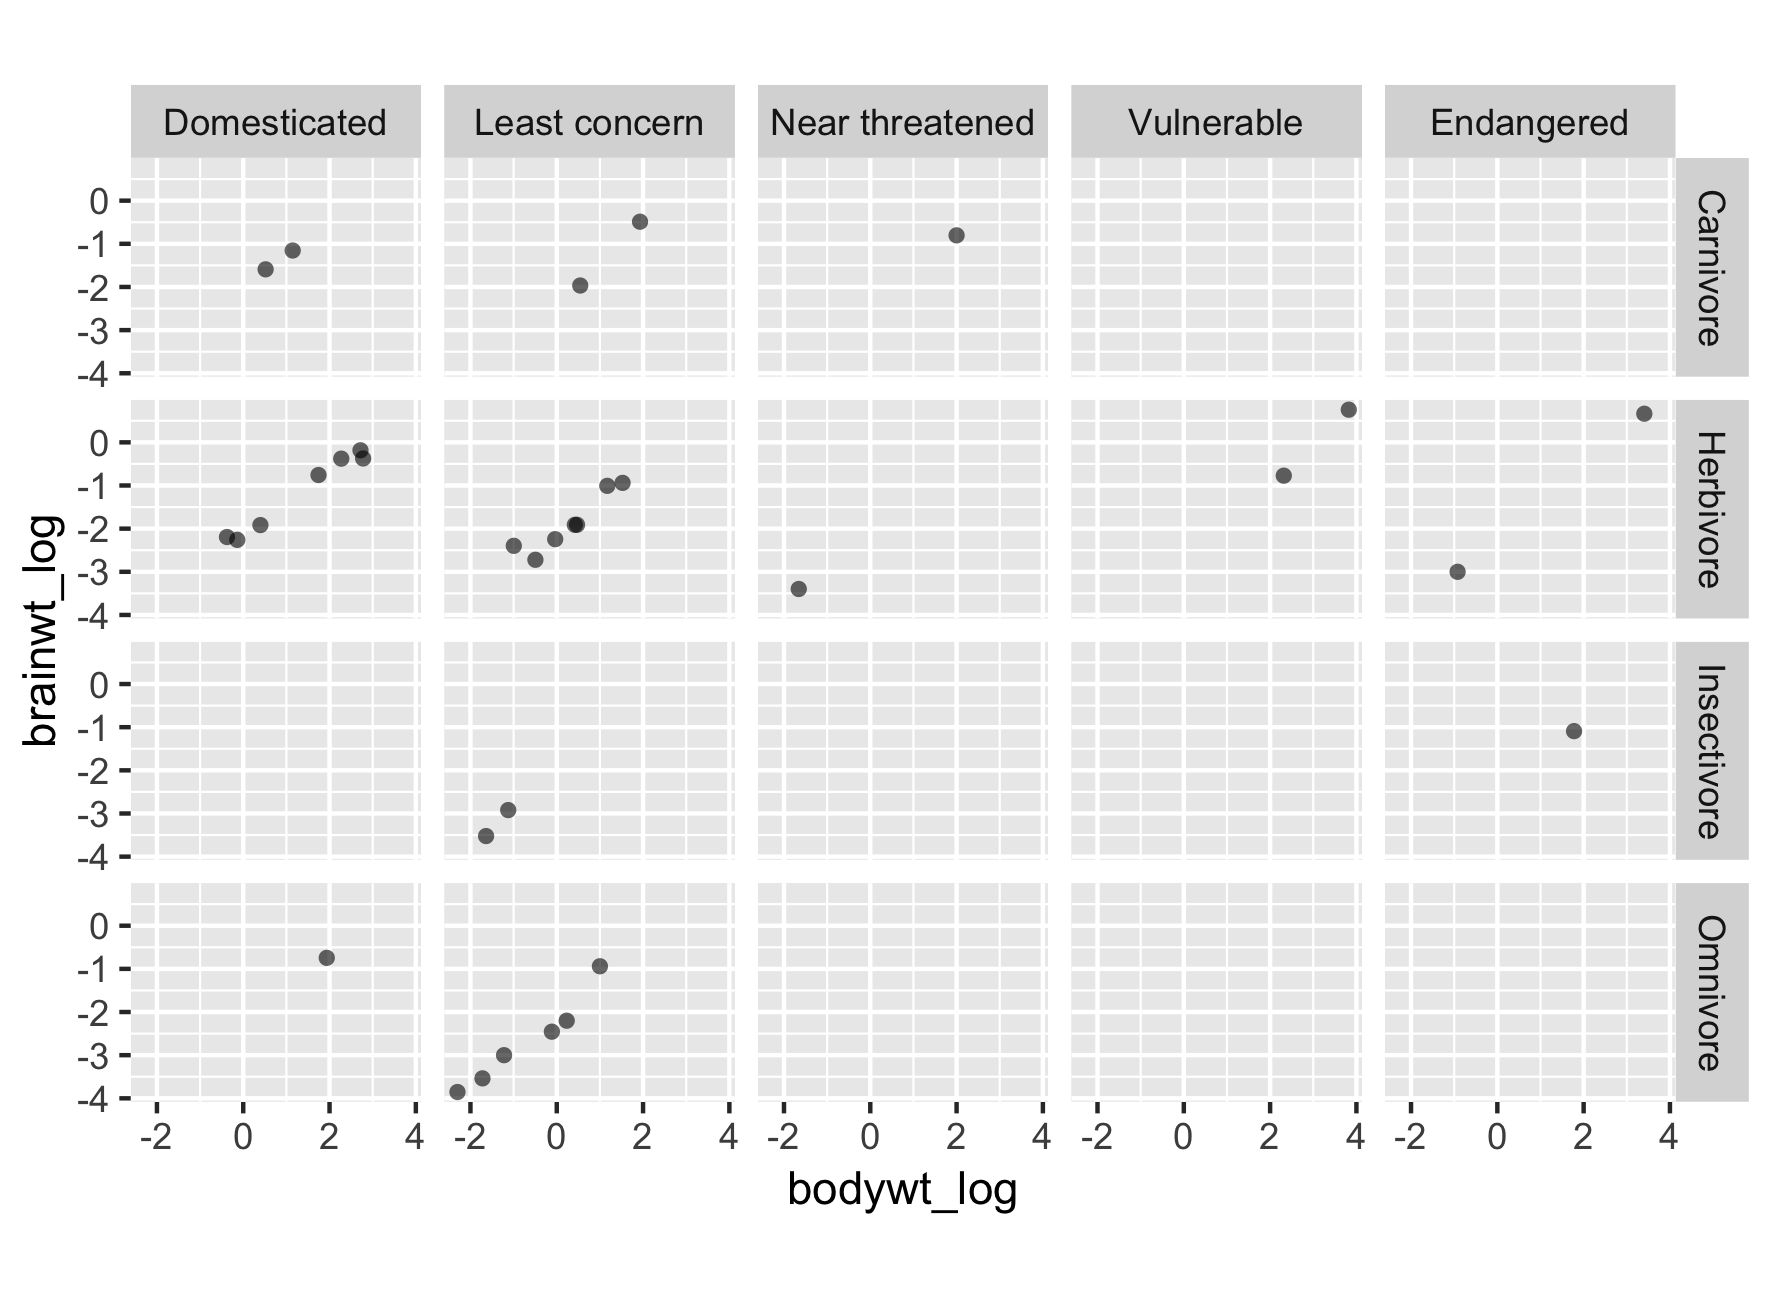
ggplot(msleep2, aes(bodywt_log,
brainwt_log)) +
geom_point(alpha = 0.6, shape = 16) +
coord_fixed() +
facet_grid(rows = vars(vore),
cols = vars(conservation))

ggplot(msleep2, aes(bodywt_log,
brainwt_log)) +
geom_point(alpha = 0.6, shape = 16) +
coord_fixed() +
facet_grid(rows = vars(vore),
cols = vars(conservation),
scales = "free_x")
Error: coord_fixed doesn't support free scales
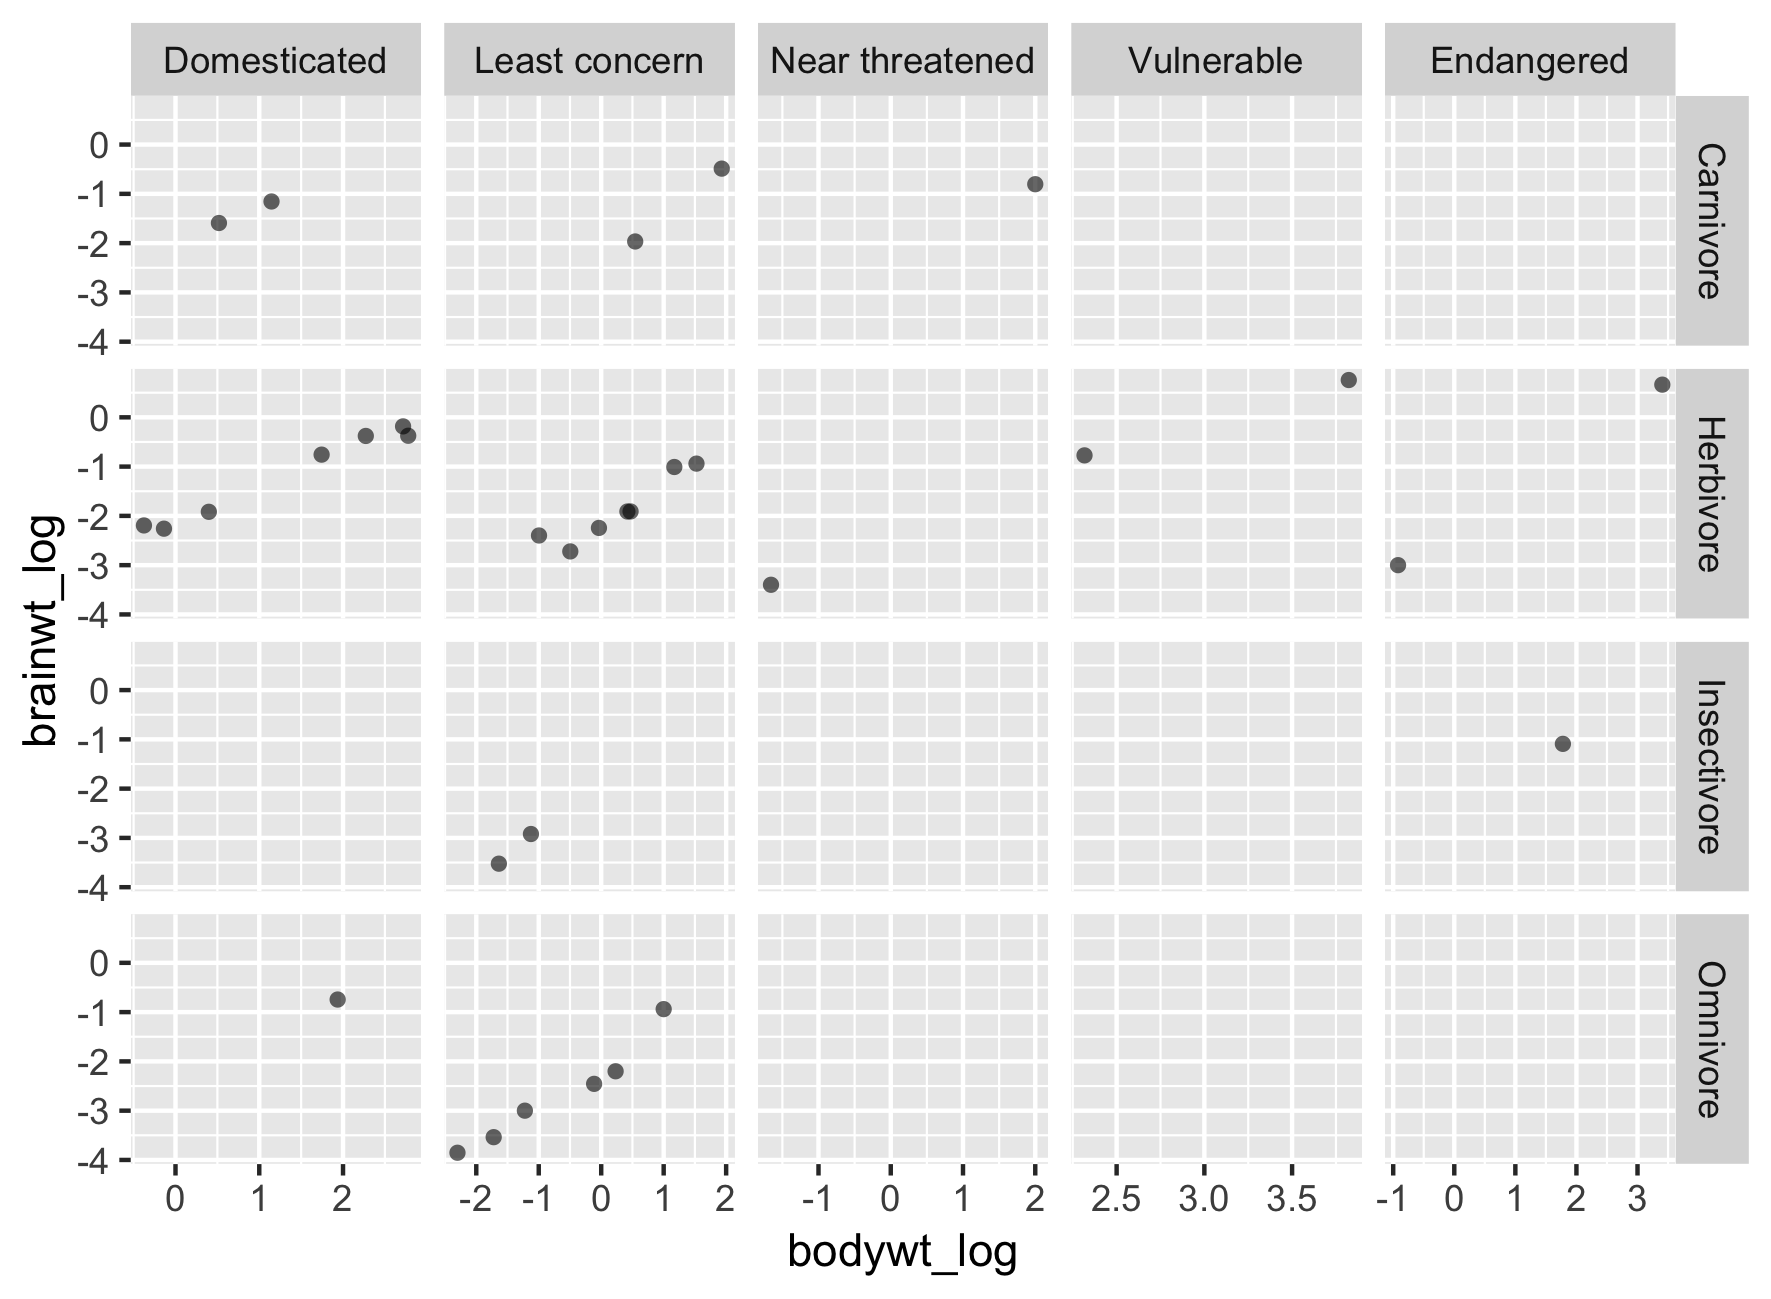
ggplot(msleep2, aes(bodywt_log,
brainwt_log)) +
geom_point(alpha = 0.6, shape = 16) +
facet_grid(rows = vars(vore),
cols = vars(conservation),
scales = "free_x")

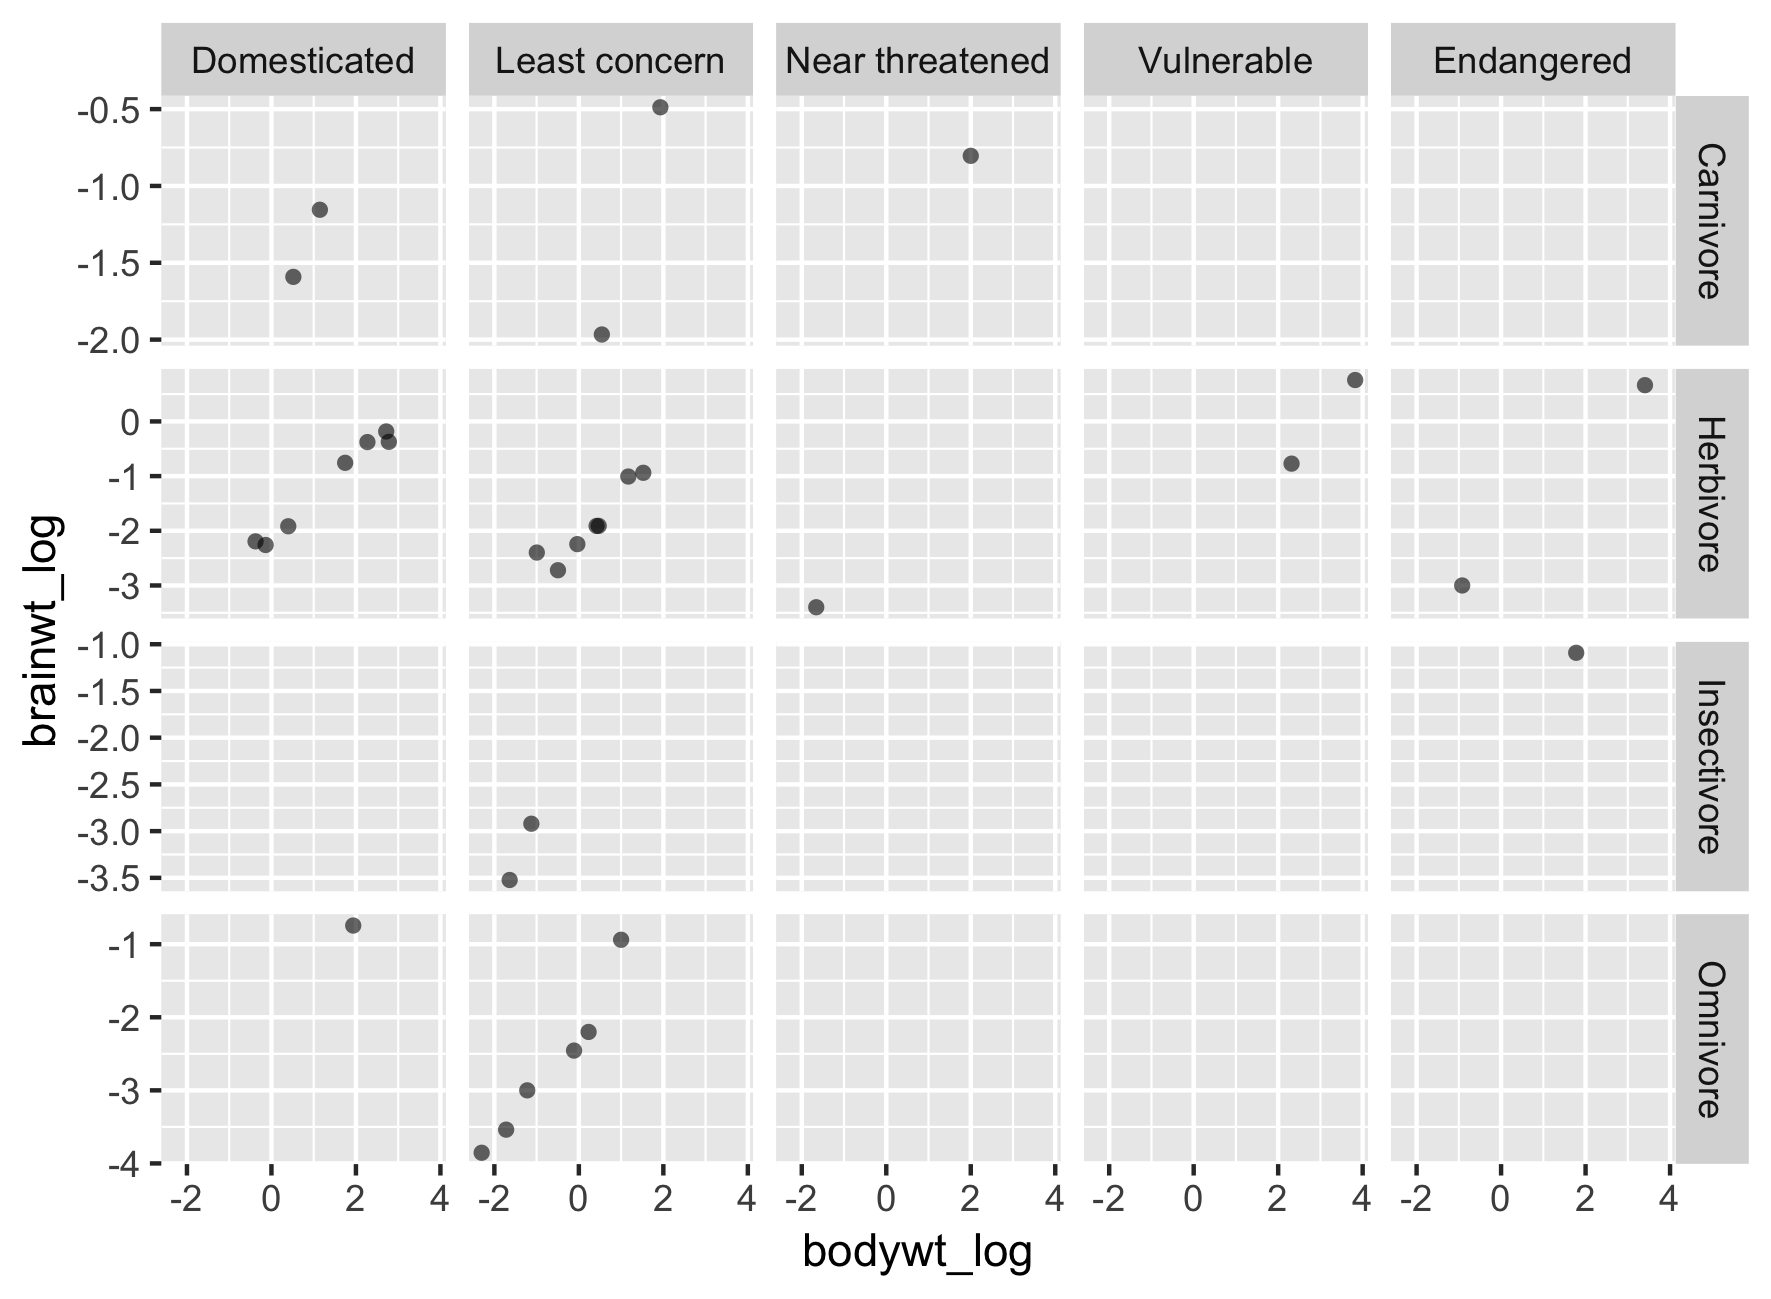
ggplot(msleep2, aes(bodywt_log,
brainwt_log)) +
geom_point(alpha = 0.6, shape = 16) +
facet_grid(rows = vars(vore),
cols = vars(conservation),
scales = "free_y")

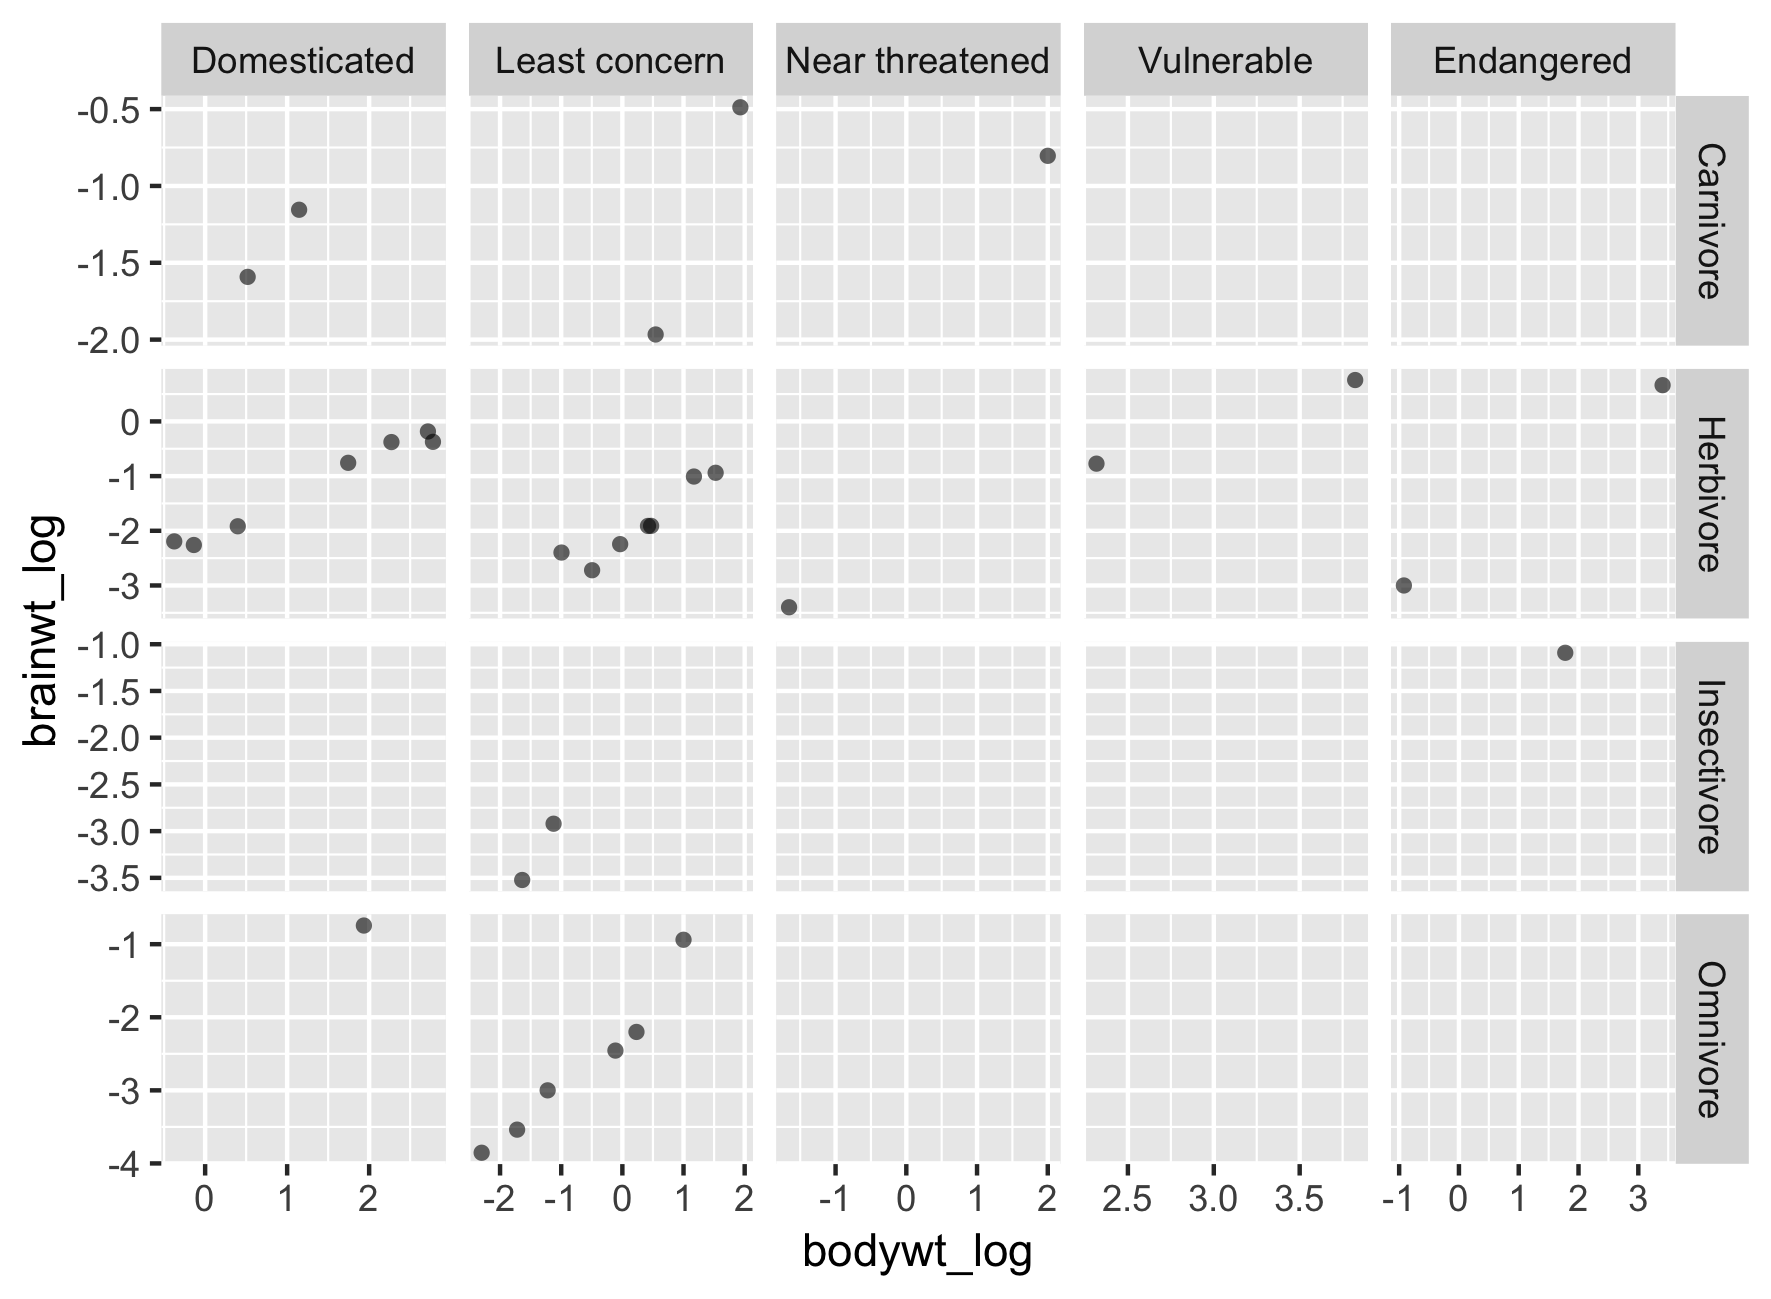
ggplot(msleep2, aes(bodywt_log,
brainwt_log)) +
geom_point(alpha = 0.6, shape = 16) +
facet_grid(rows = vars(vore),
cols = vars(conservation),
scales = "free")

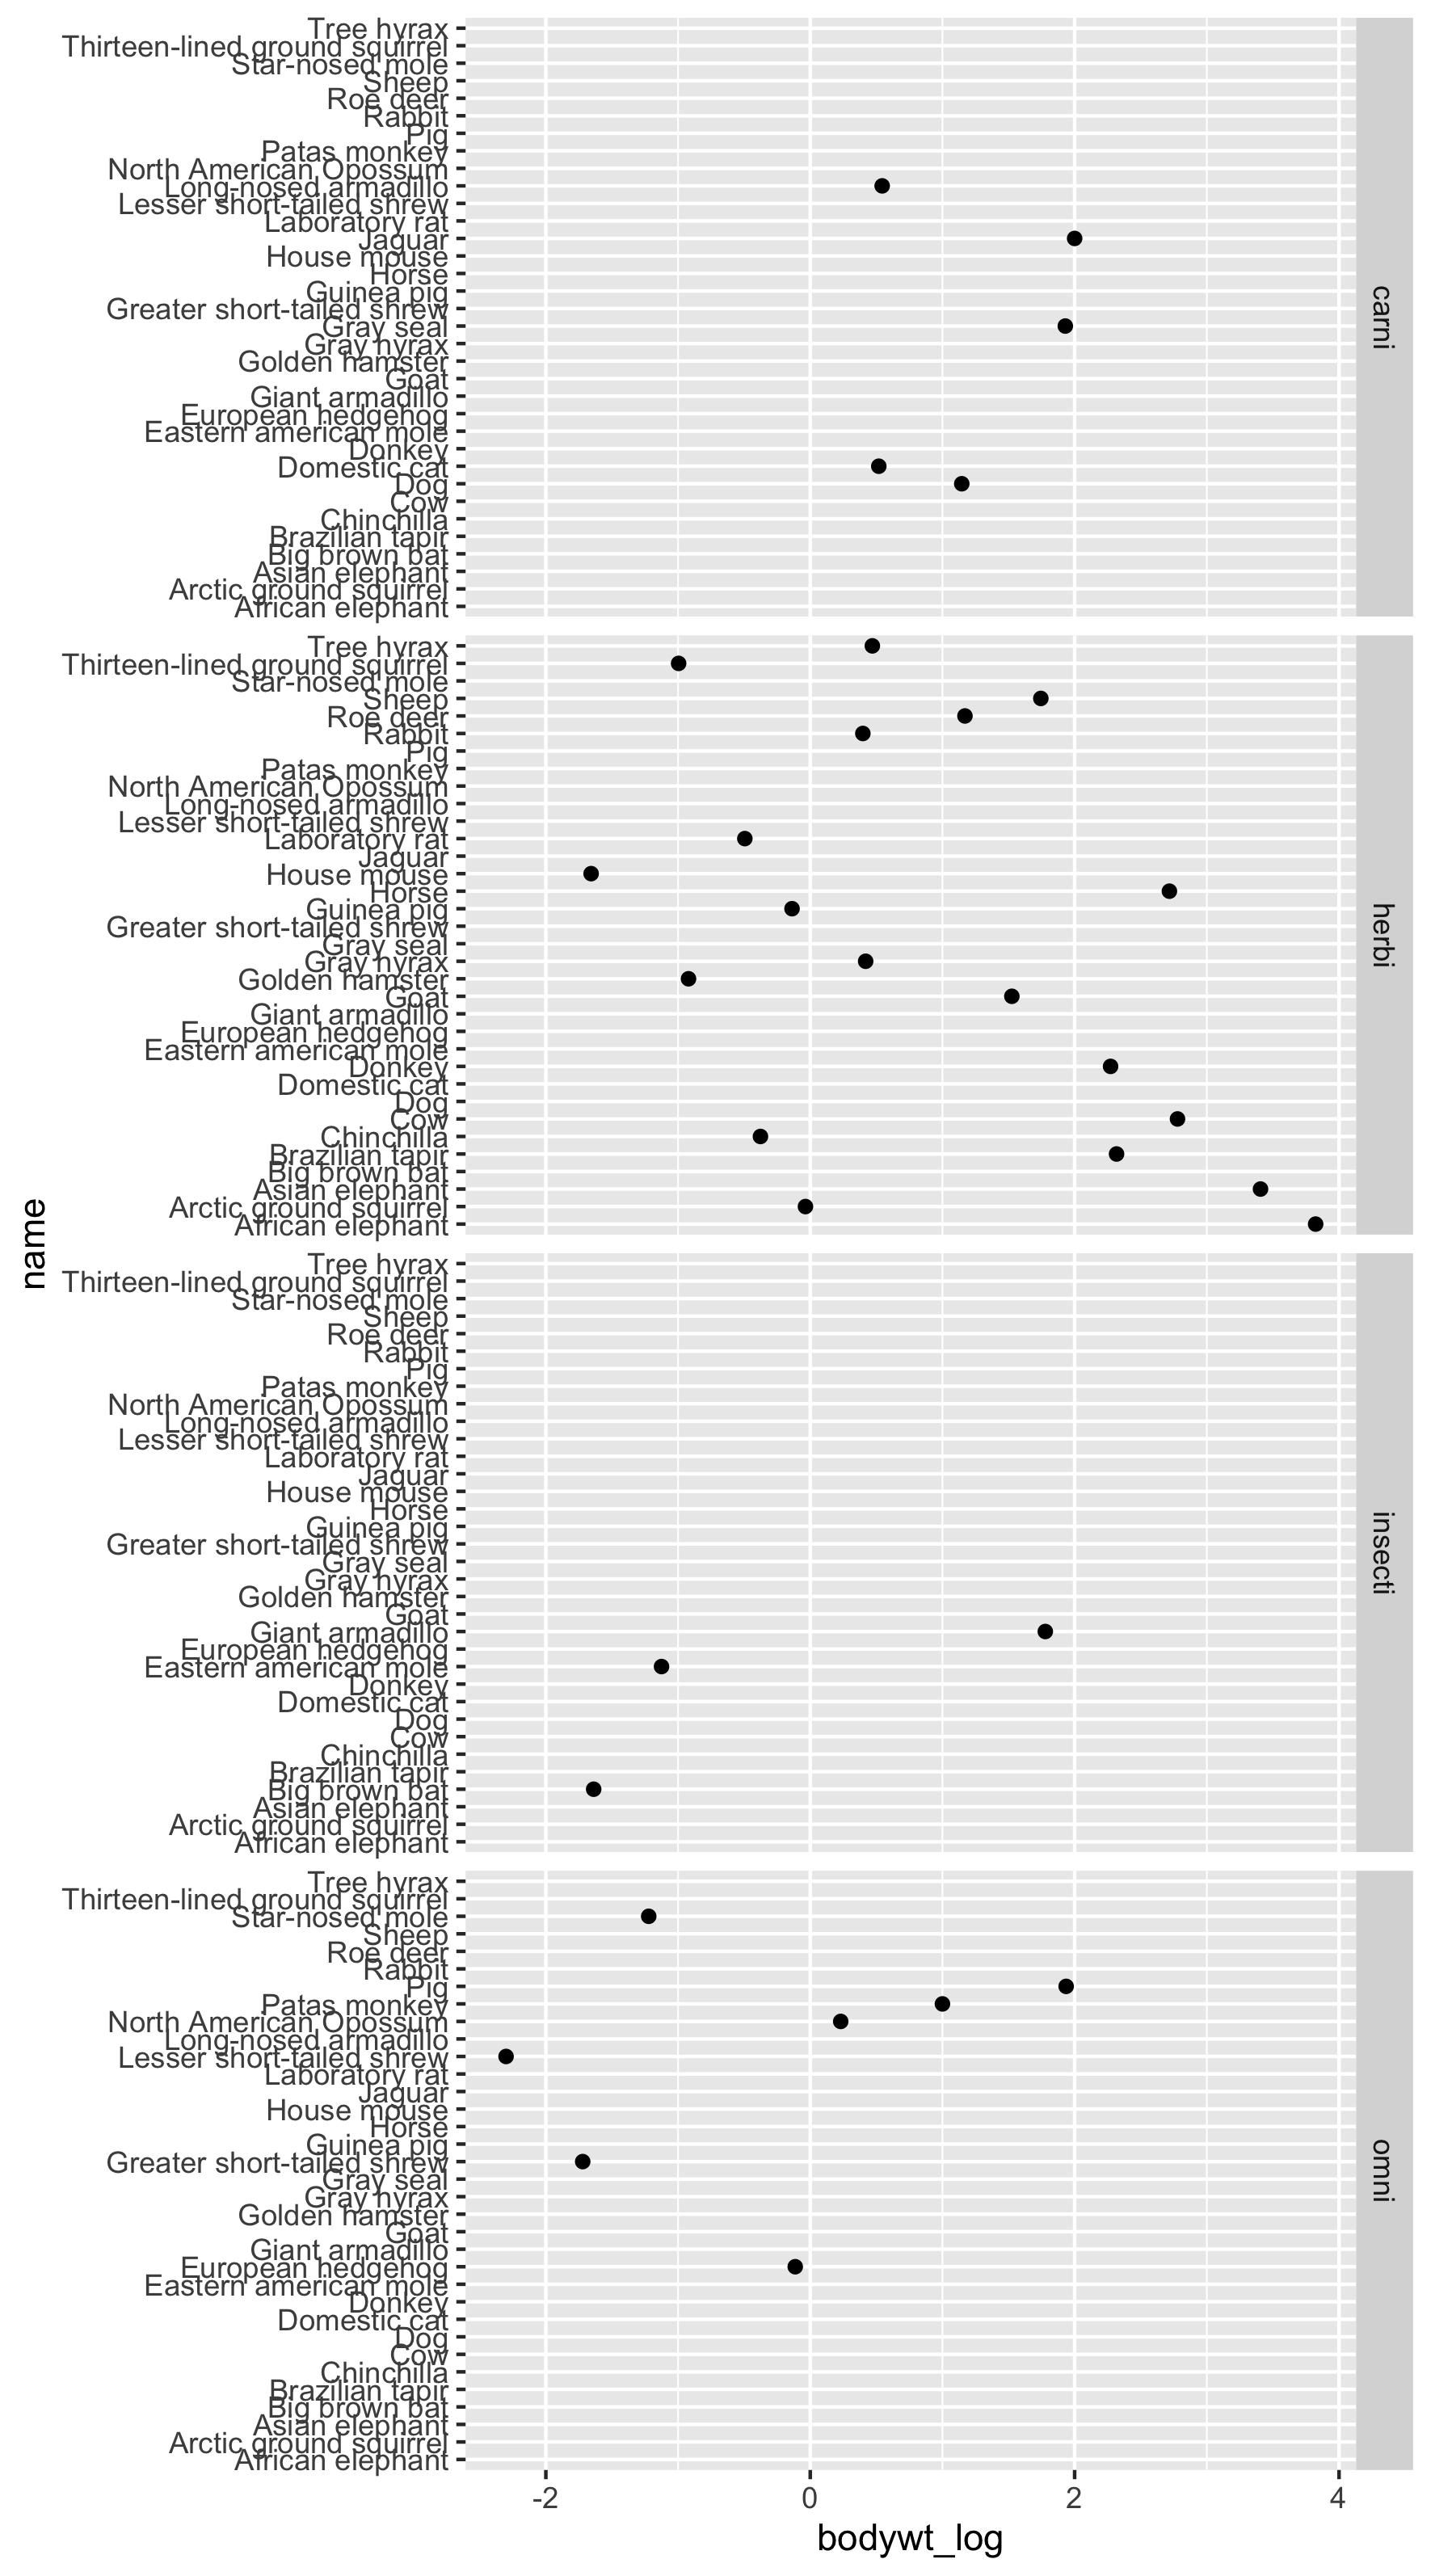
ggplot(msleep2, aes(x = bodywt_log,
y = name)) +
geom_point() +
facet_grid(rows = vars(vore))

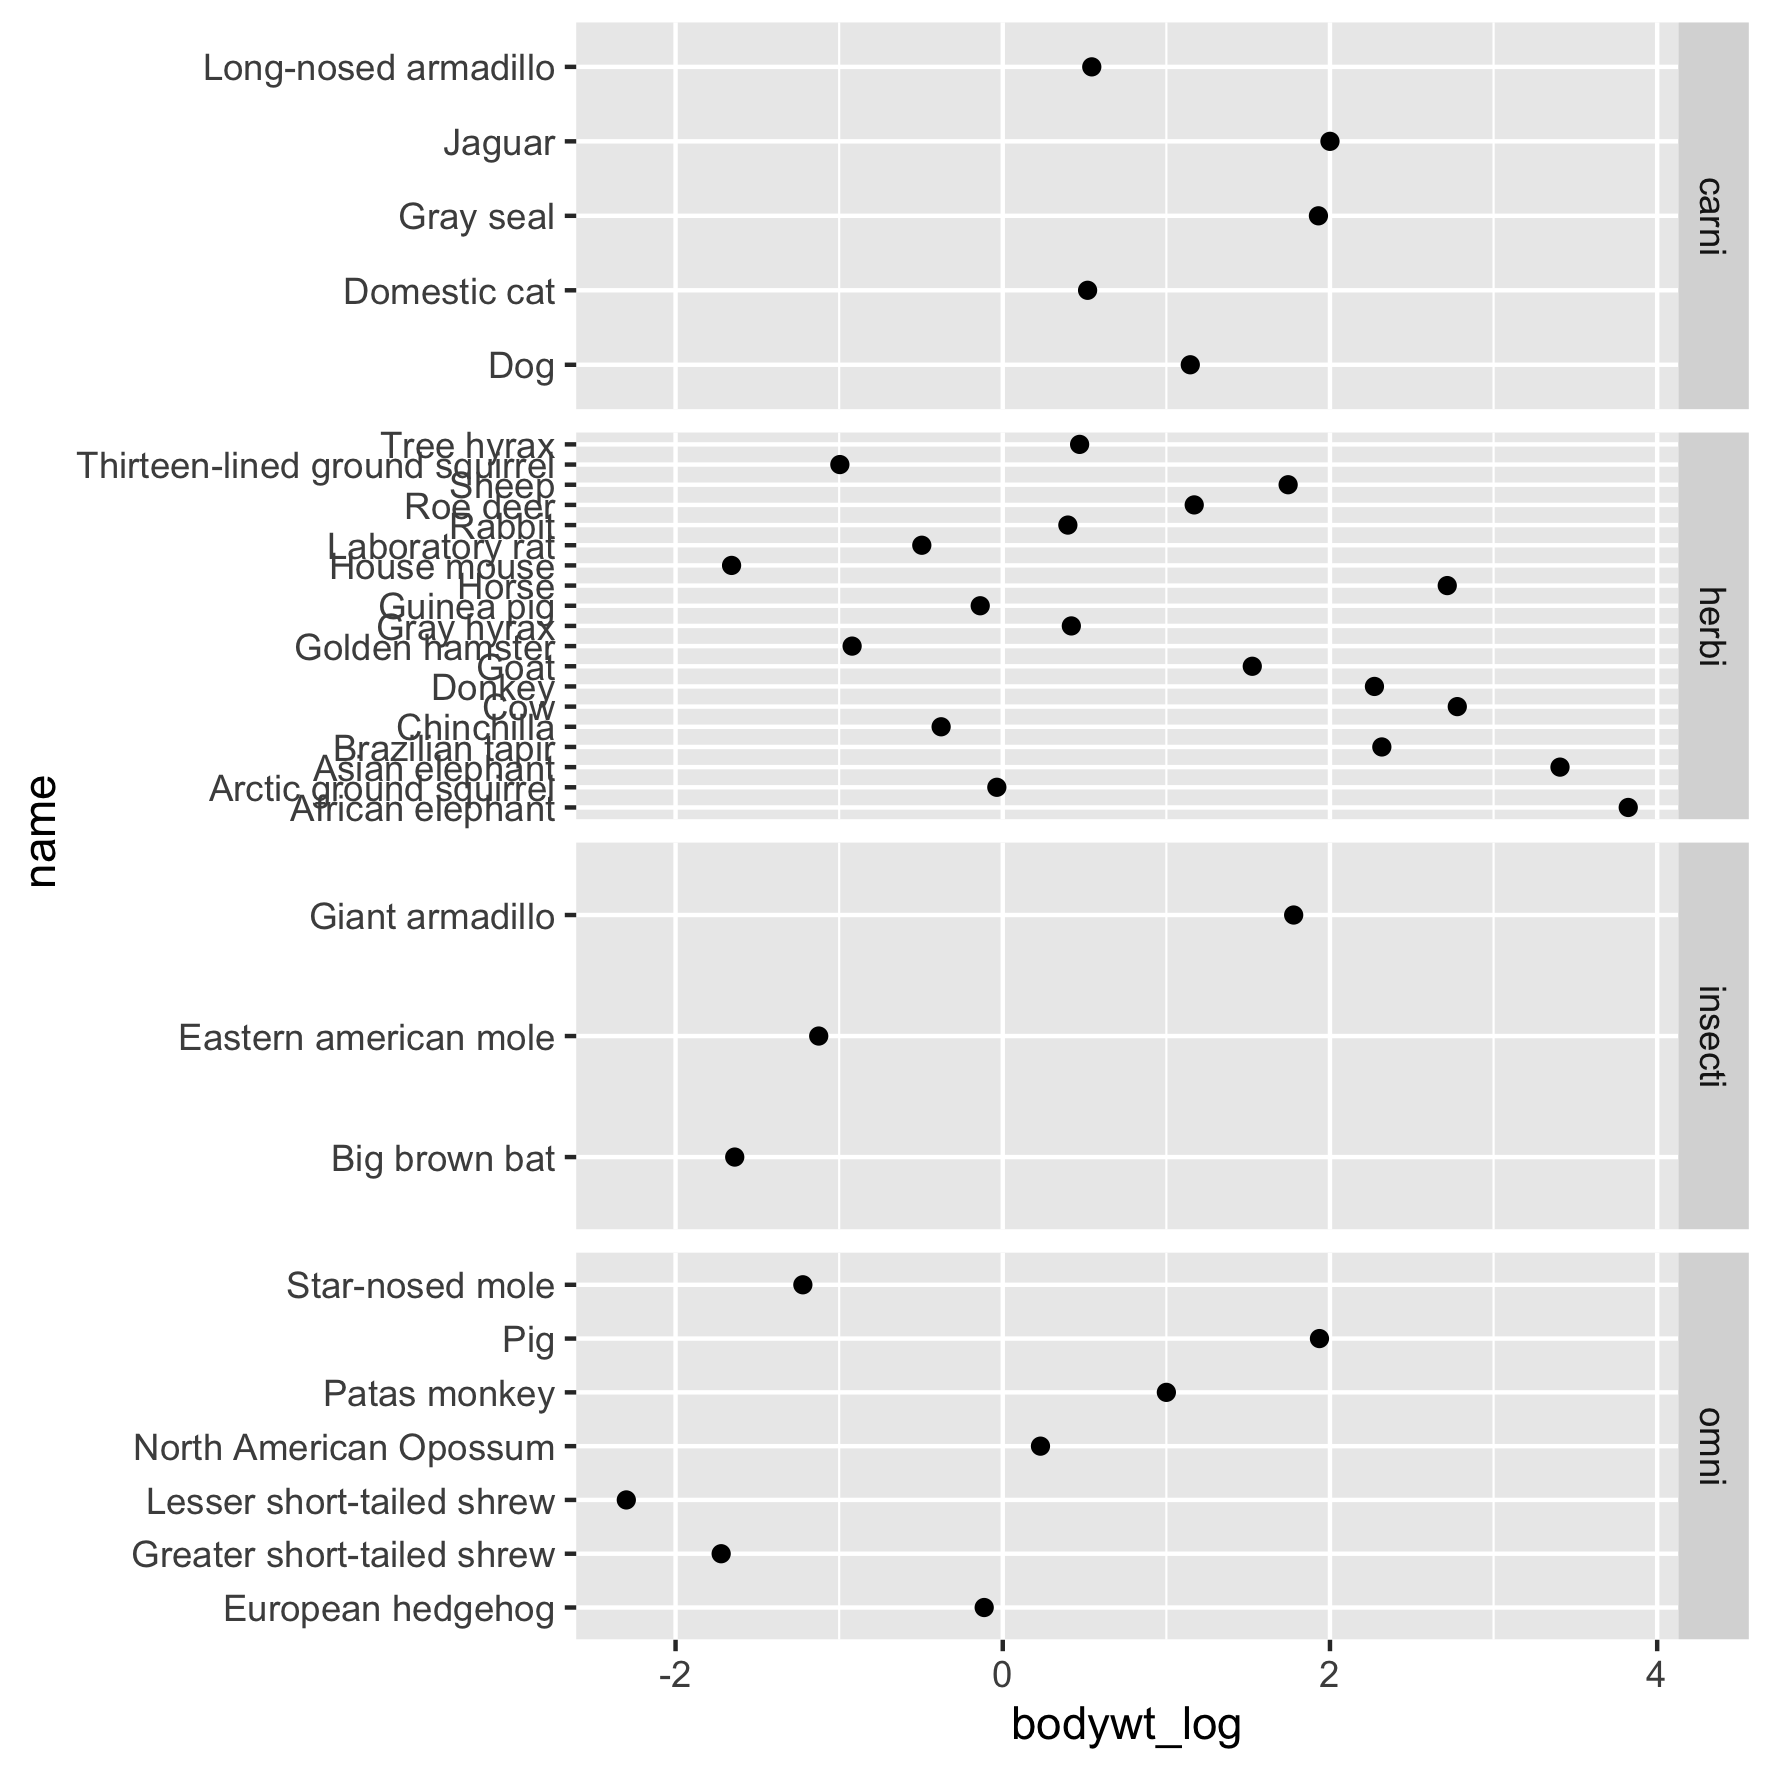
ggplot(msleep2, aes(x = bodywt_log,
y = name)) +
geom_point() +
# y स्केल और स्पेस को फ्री करें
facet_grid(rows = vars(vore),
scales = "free_y")

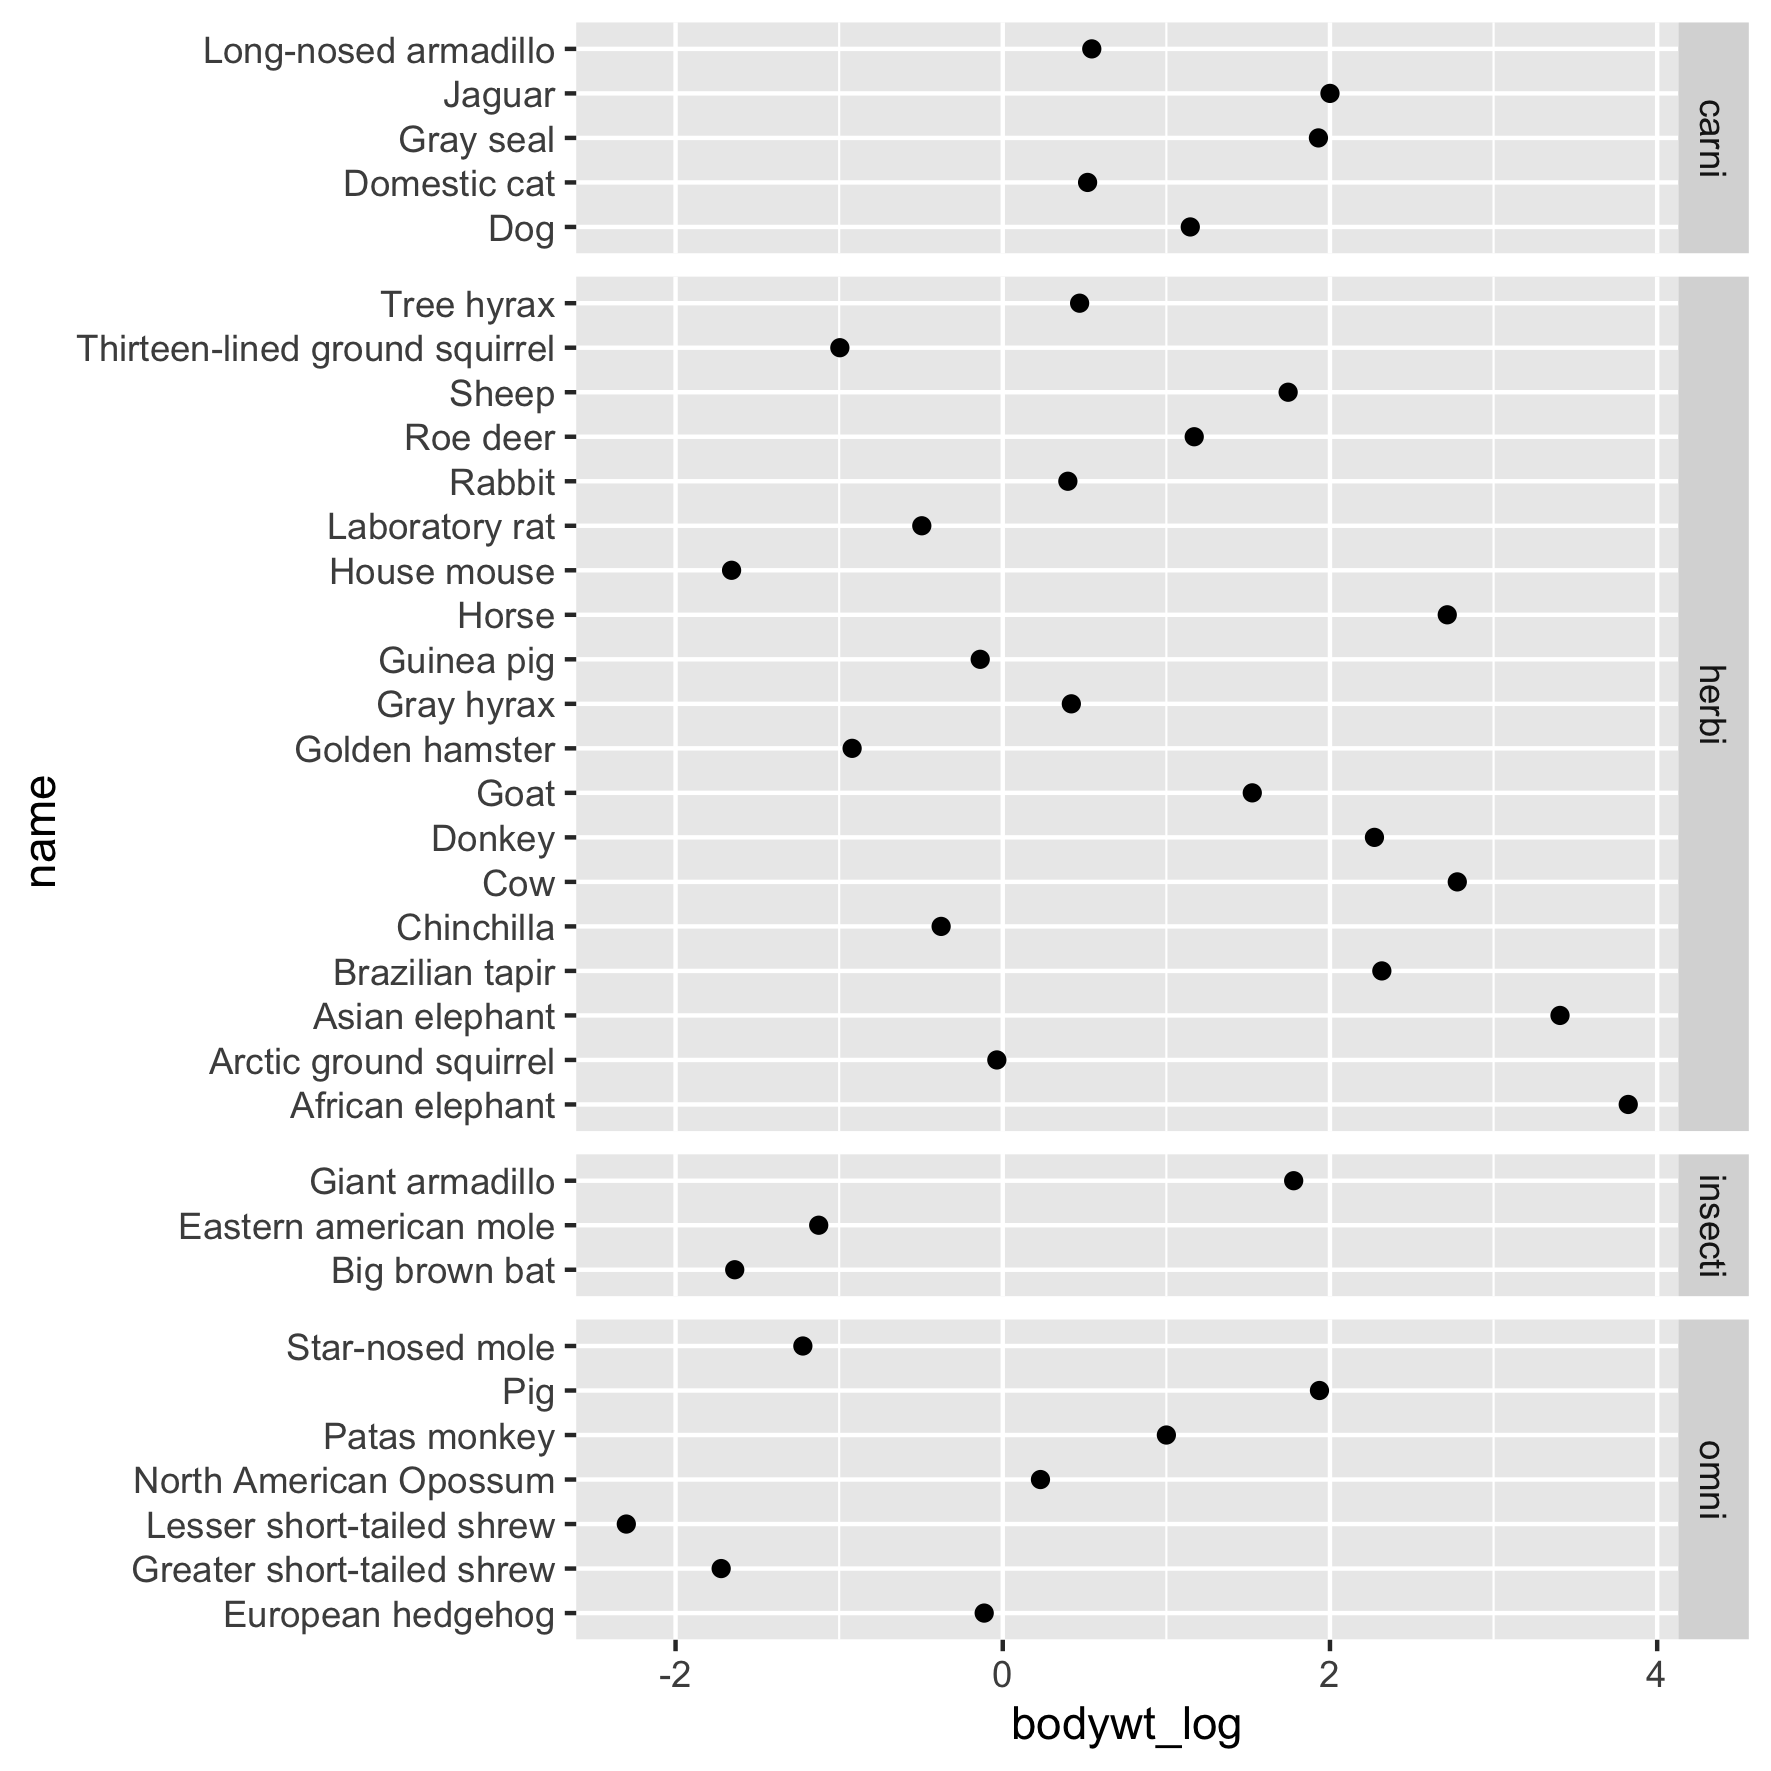
ggplot(msleep2, aes(x = bodywt_log,
y = name)) +
geom_point() +
# y स्केल और स्पेस को फ्री करें
facet_grid(rows = vars(vore),
scales = "free_y",
space = "free_y")

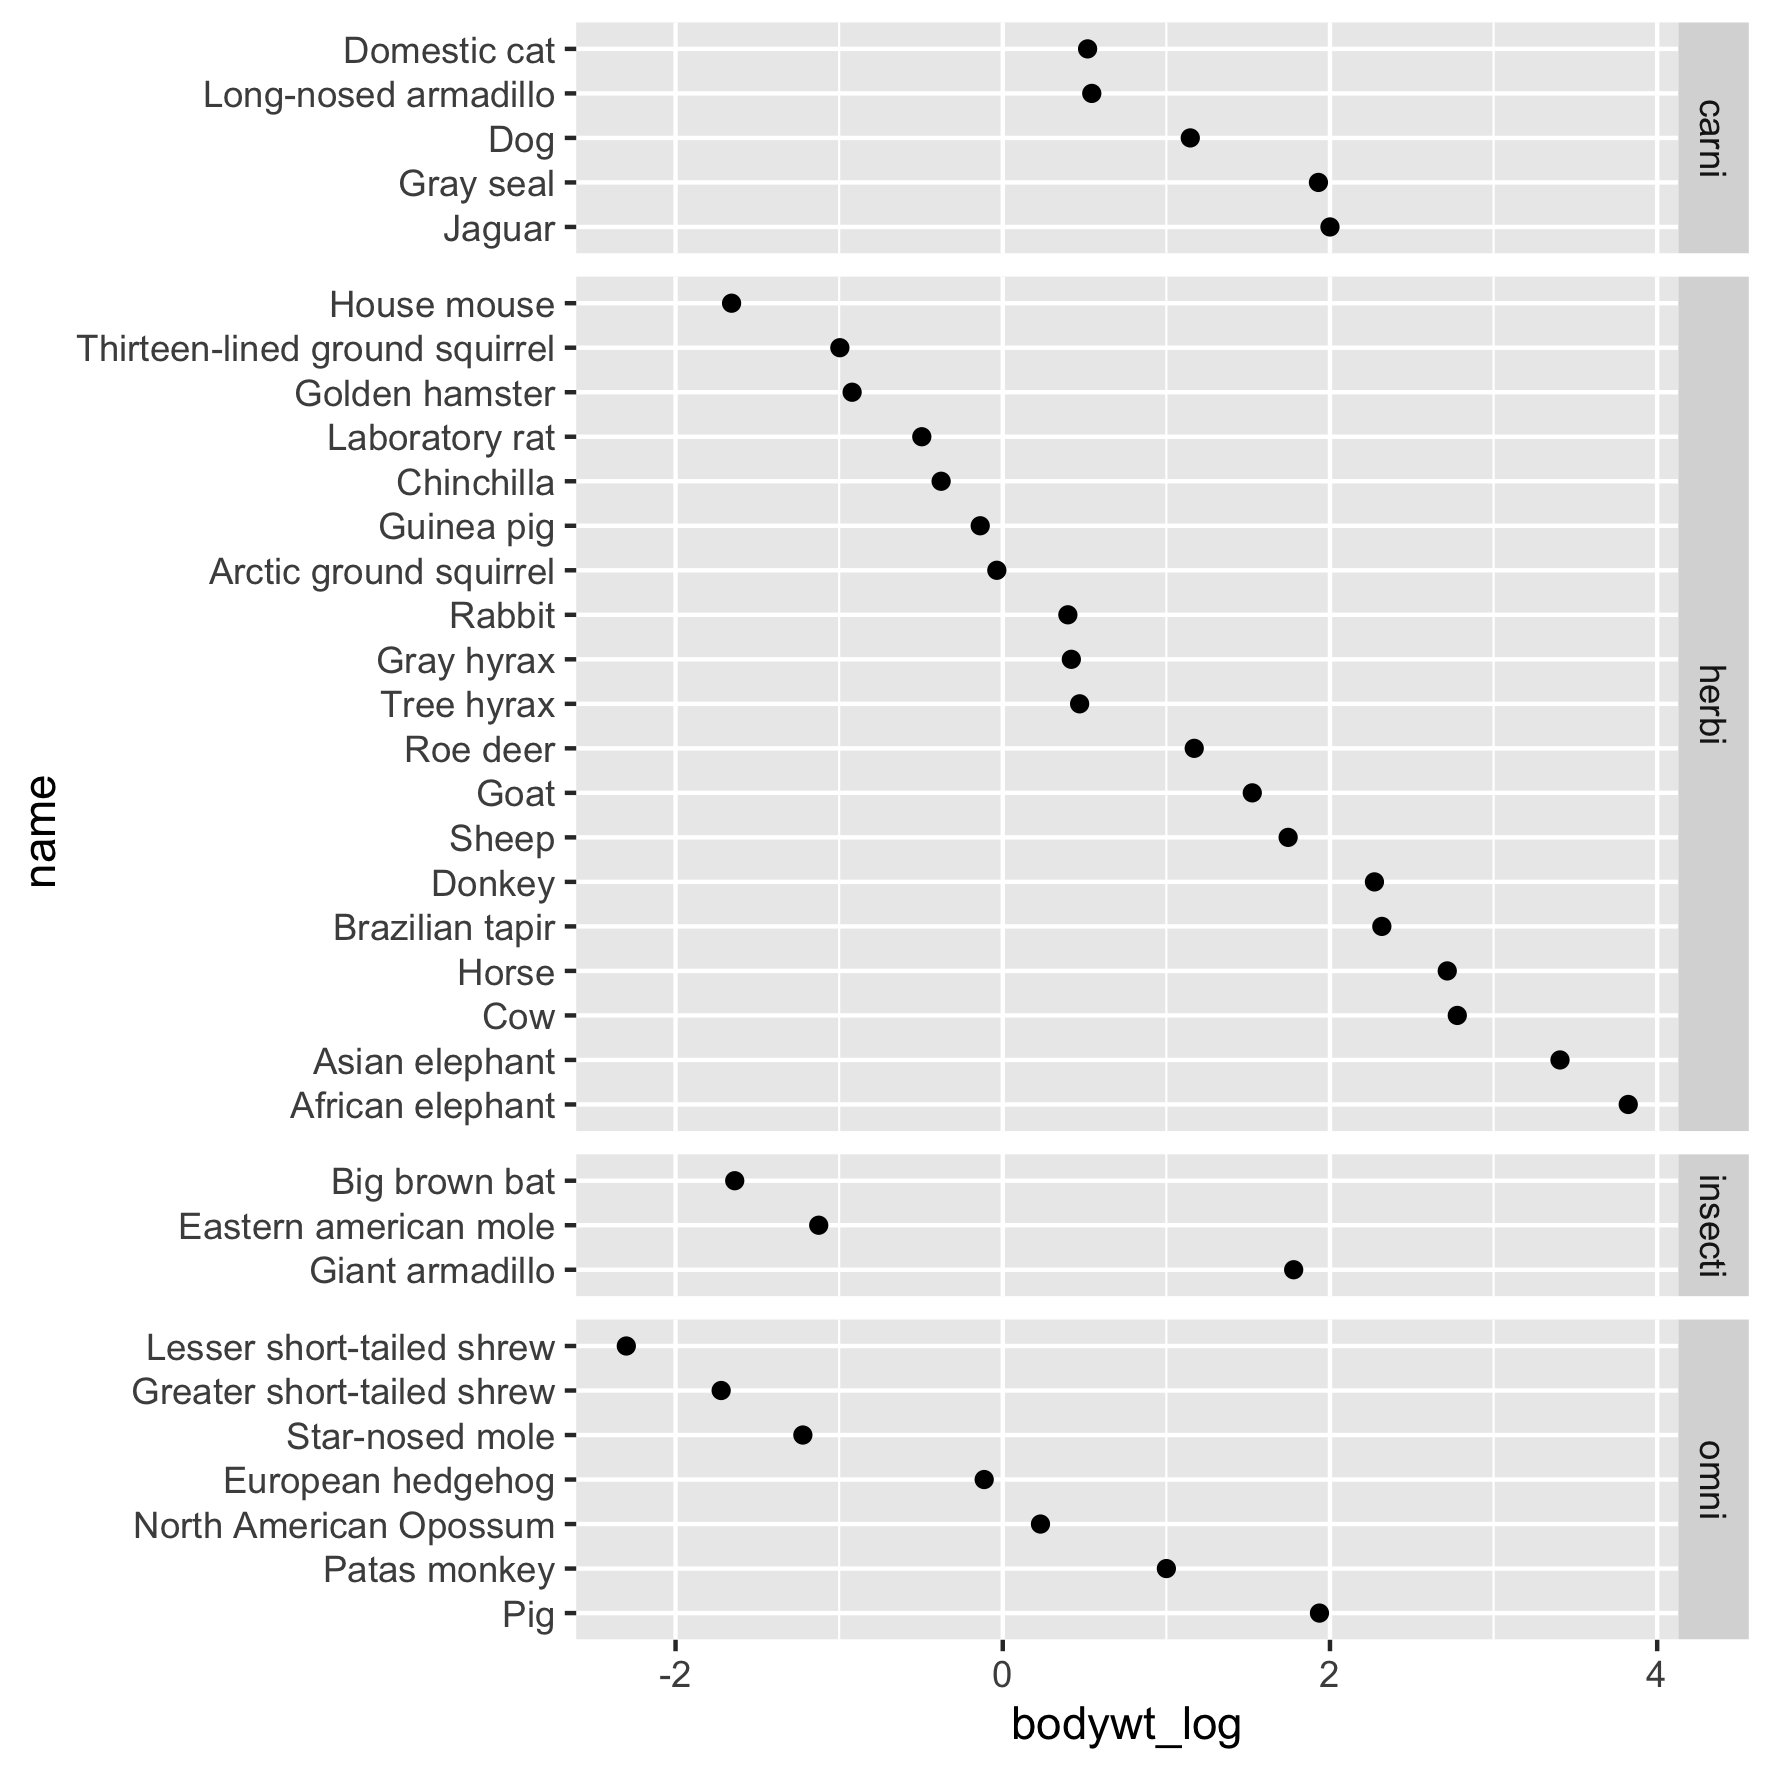
msleep2 <- msleep2 %>%
# वजन को उच्च से निम्न क्रम में करें
arrange(-bodywt_log) %>%
# उसी क्रम में factor स्तर सेट करें
mutate(name = as_factor(name))
# नया क्रम y अक्ष पर दिखता है
ggplot(msleep2, aes(x = bodywt_log,
y = name)) +
geom_point() +
# y स्केल और स्पेस को फ्री करें
facet_grid(rows = vars(vore),
scales = "free_y",
space = "free_y")

इंटरमीडिएट Data Visualization with ggplot2