Stats: sum और quantile

इंटरमीडिएट Data Visualization with ggplot2

Rick Scavetta

Founder, Scavetta Academy

कोर्स 1 से रिकॉल

ओवर-प्लॉटिंग का कारण समाधान
1. बड़े datasets Alpha-blending, खोखले सर्कल, point size
2. एक ही अक्ष पर संरेखित मान ऊपर जैसा, साथ ही position बदलें
3. लो-प्रिसिशन डेटा Position: jitter
4. Integer डेटा Position: jitter
इंटरमीडिएट Data Visualization with ggplot2

ओवर-प्लॉटिंग से निपटने को counts प्लॉट करें

ओवर-प्लॉटिंग का कारण समाधान यहाँ...
1. बड़े datasets Alpha-blending, खोखले सर्कल, point size
2. एक ही अक्ष पर संरेखित मान ऊपर जैसा, साथ ही position बदलें
3. लो-प्रिसिशन डेटा Position: jitter geom_count()
4. Integer डेटा Position: jitter geom_count()
इंटरमीडिएट Data Visualization with ggplot2

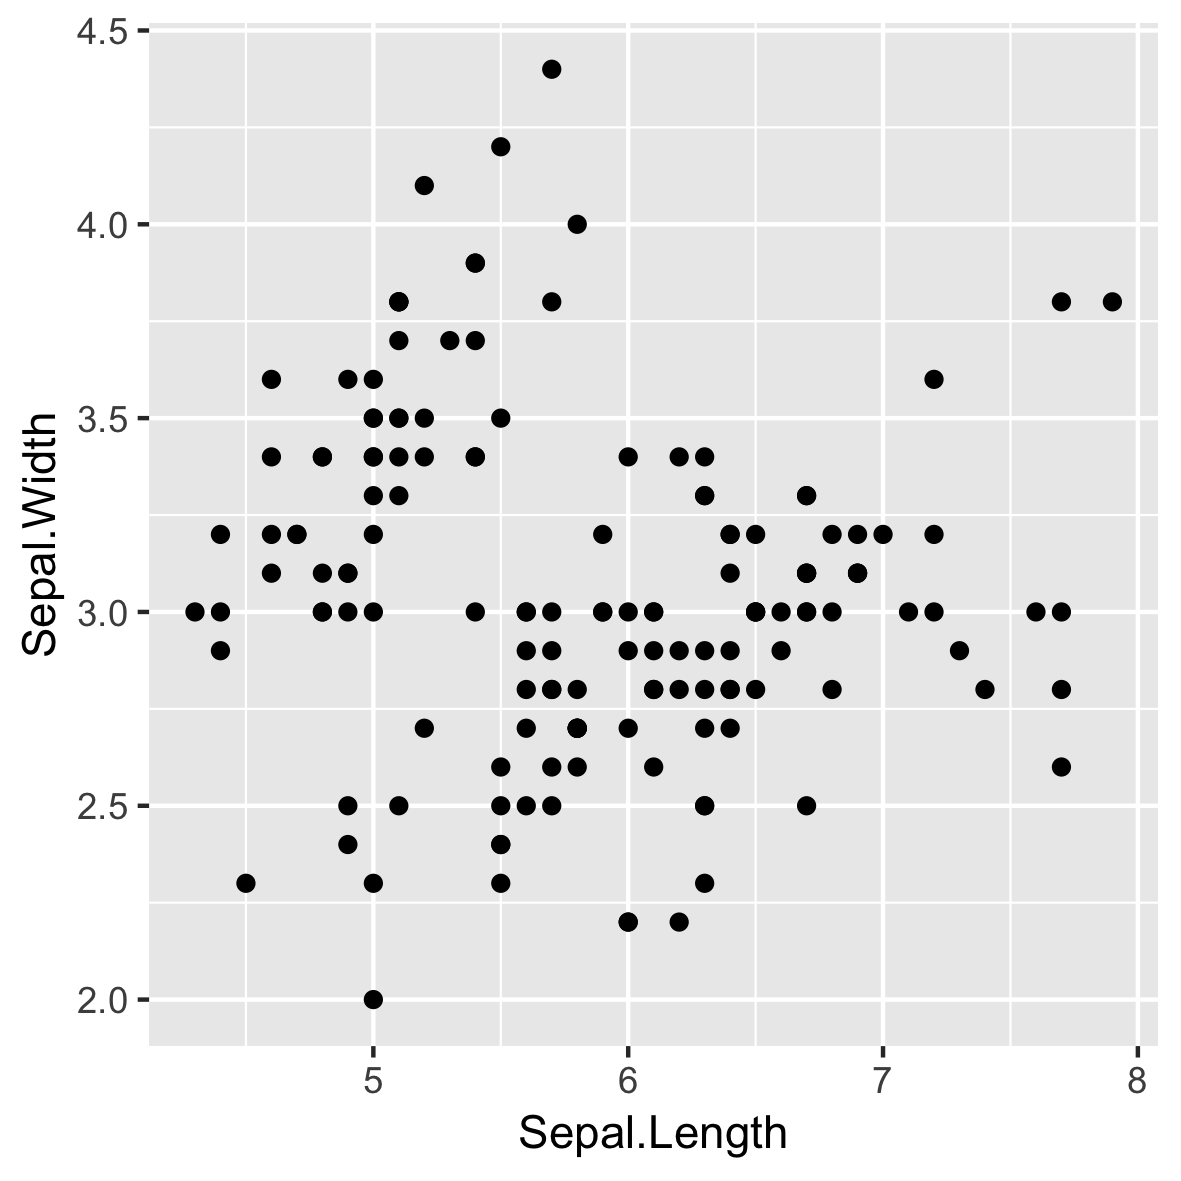
लो प्रिसिशन (और integer) डेटा

p <- ggplot(iris, aes(Sepal.Length, 
                      Sepal.Width))

p + geom_point()

इंटरमीडिएट Data Visualization with ggplot2

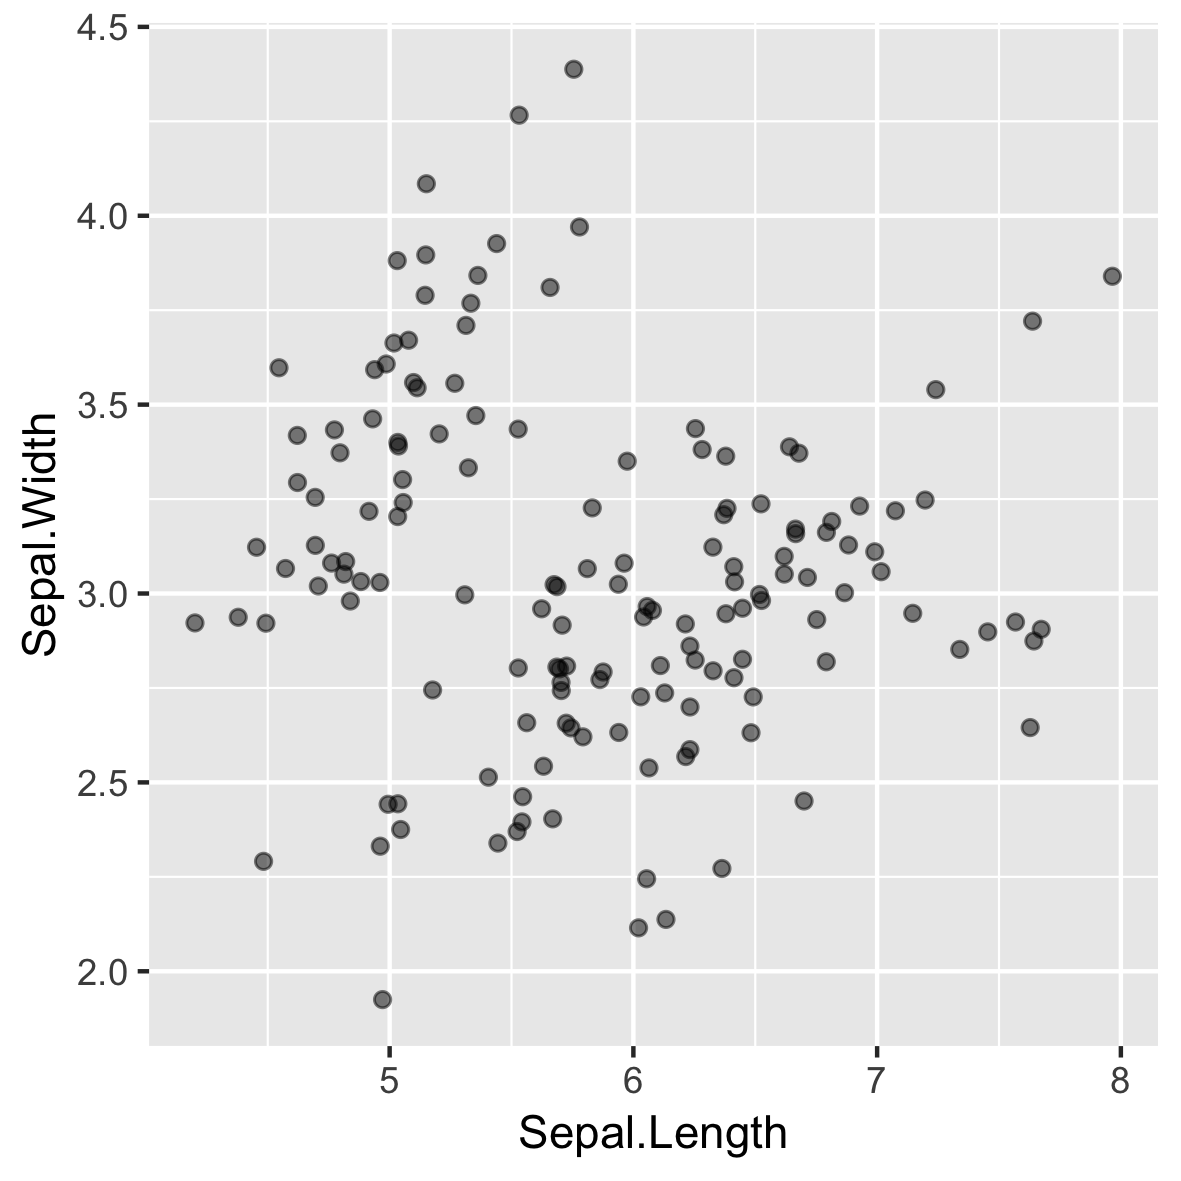
Jittering गलत प्रभाव दे सकता है

p + geom_jitter(alpha = 0.5,
                width = 0.1,
                height = 0.1)

इंटरमीडिएट Data Visualization with ggplot2

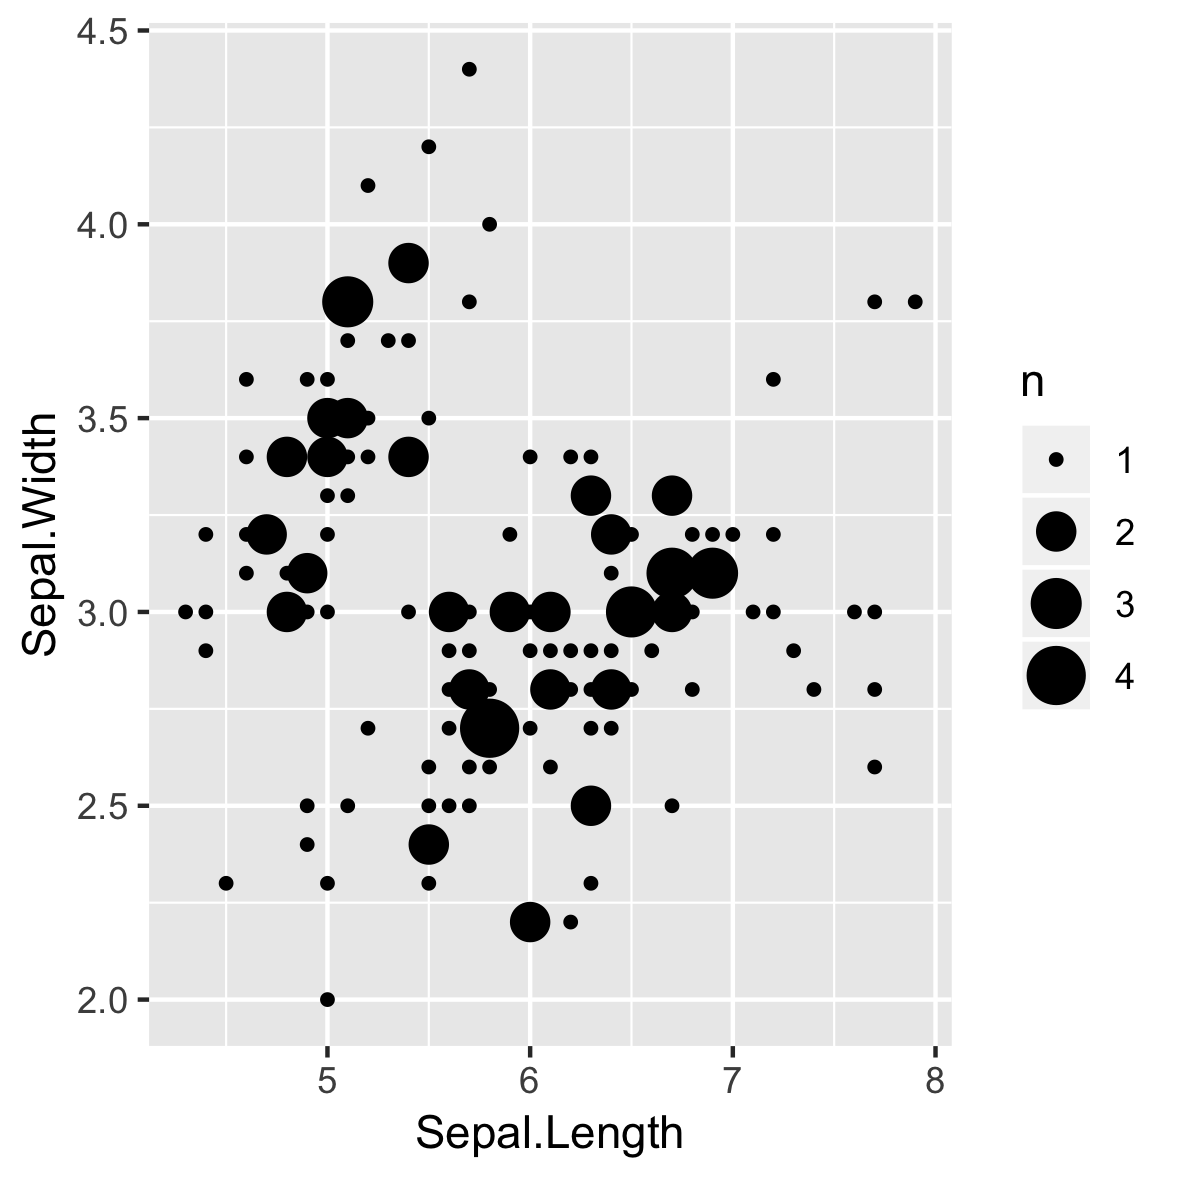
geom_count()

p + 
  geom_count()

इंटरमीडिएट Data Visualization with ggplot2

geom/stat कनेक्शन

geom_ stat_
geom_count() stat_sum()
इंटरमीडिएट Data Visualization with ggplot2

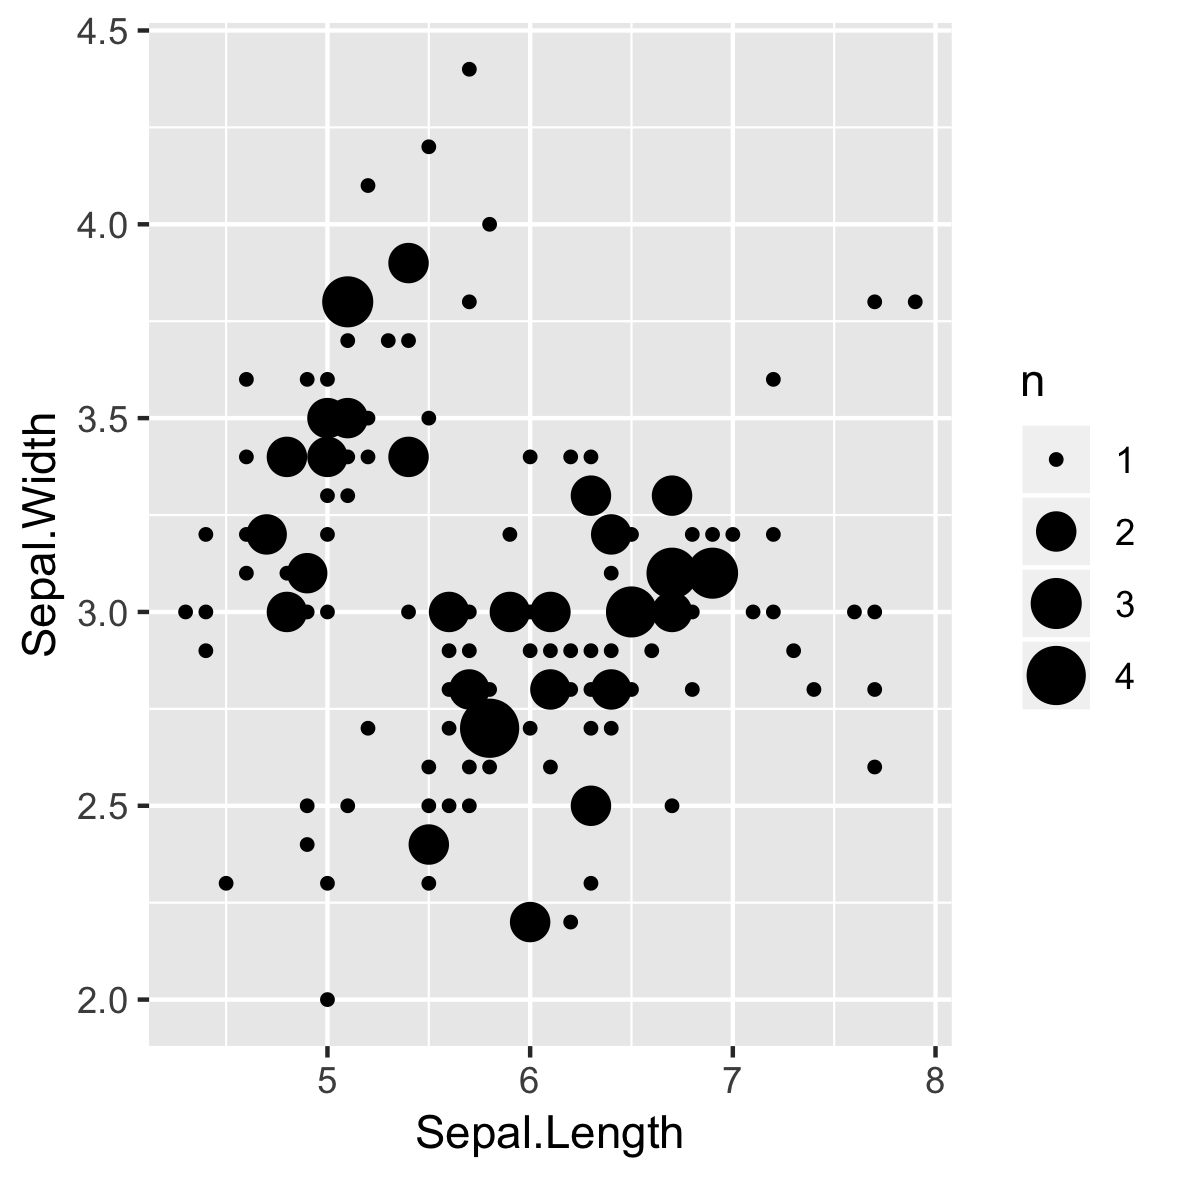
stat_sum()

p + 
  stat_sum()

इंटरमीडिएट Data Visualization with ggplot2

ओवर-प्लॉटिंग अब भी समस्या हो सकती है!
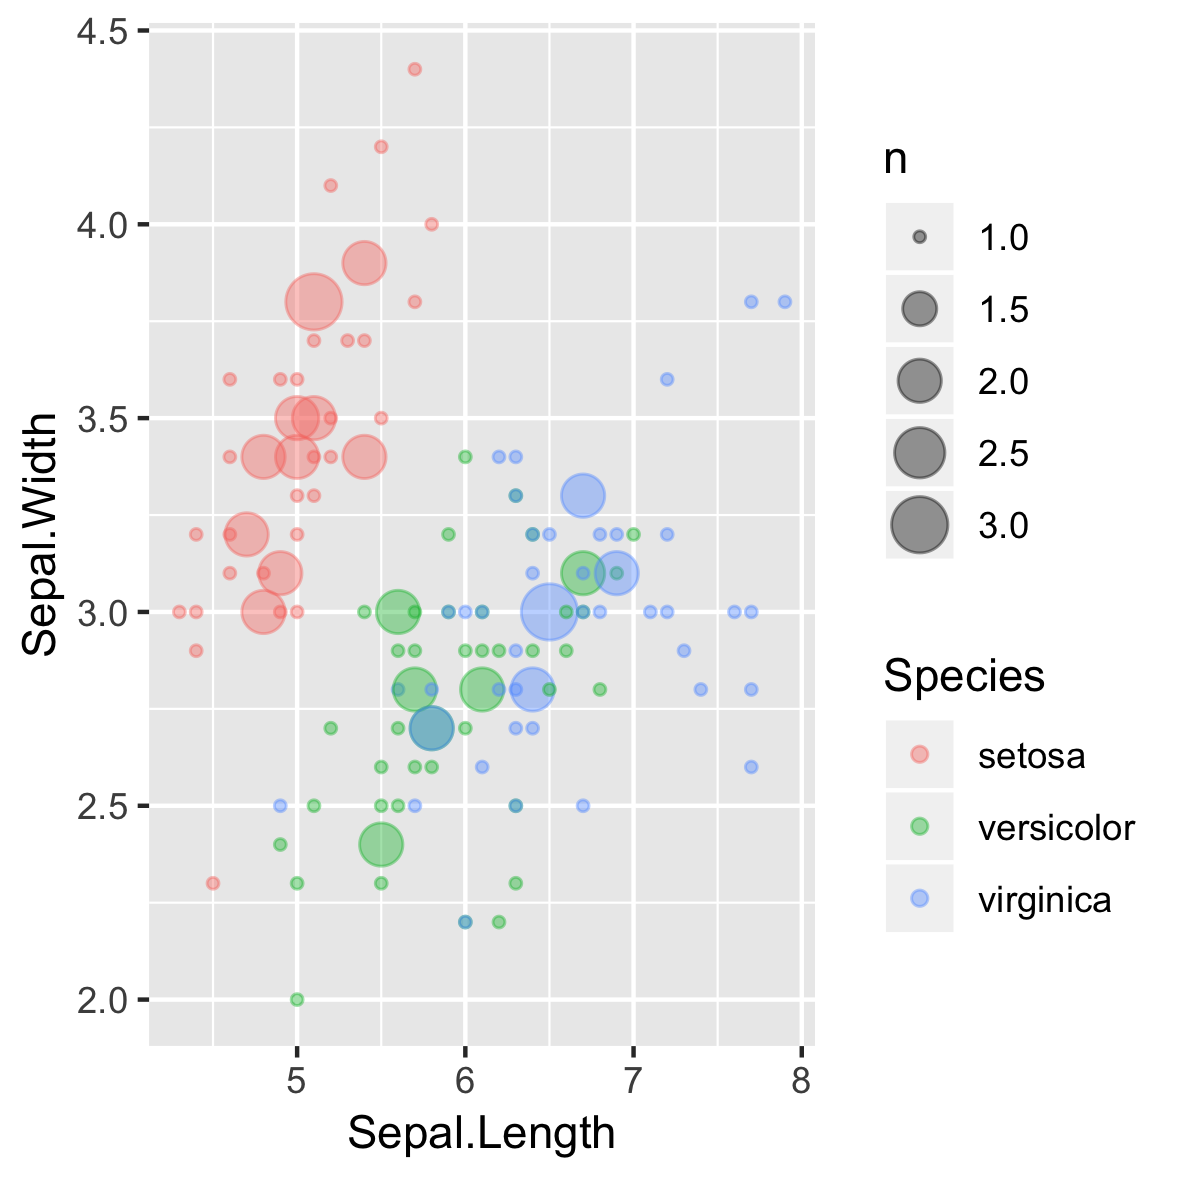
ggplot(iris, aes(Sepal.Length,
                 Sepal.Width, 
                 color = Species)) + 
  geom_count(alpha = 0.4)

इंटरमीडिएट Data Visualization with ggplot2

geom_quantile()

ggplot(iris, aes(Sepal.Length,
                 Sepal.Width, 
                 color = Species)) + 
  geom_count(alpha = 0.4)
इंटरमीडिएट Data Visualization with ggplot2

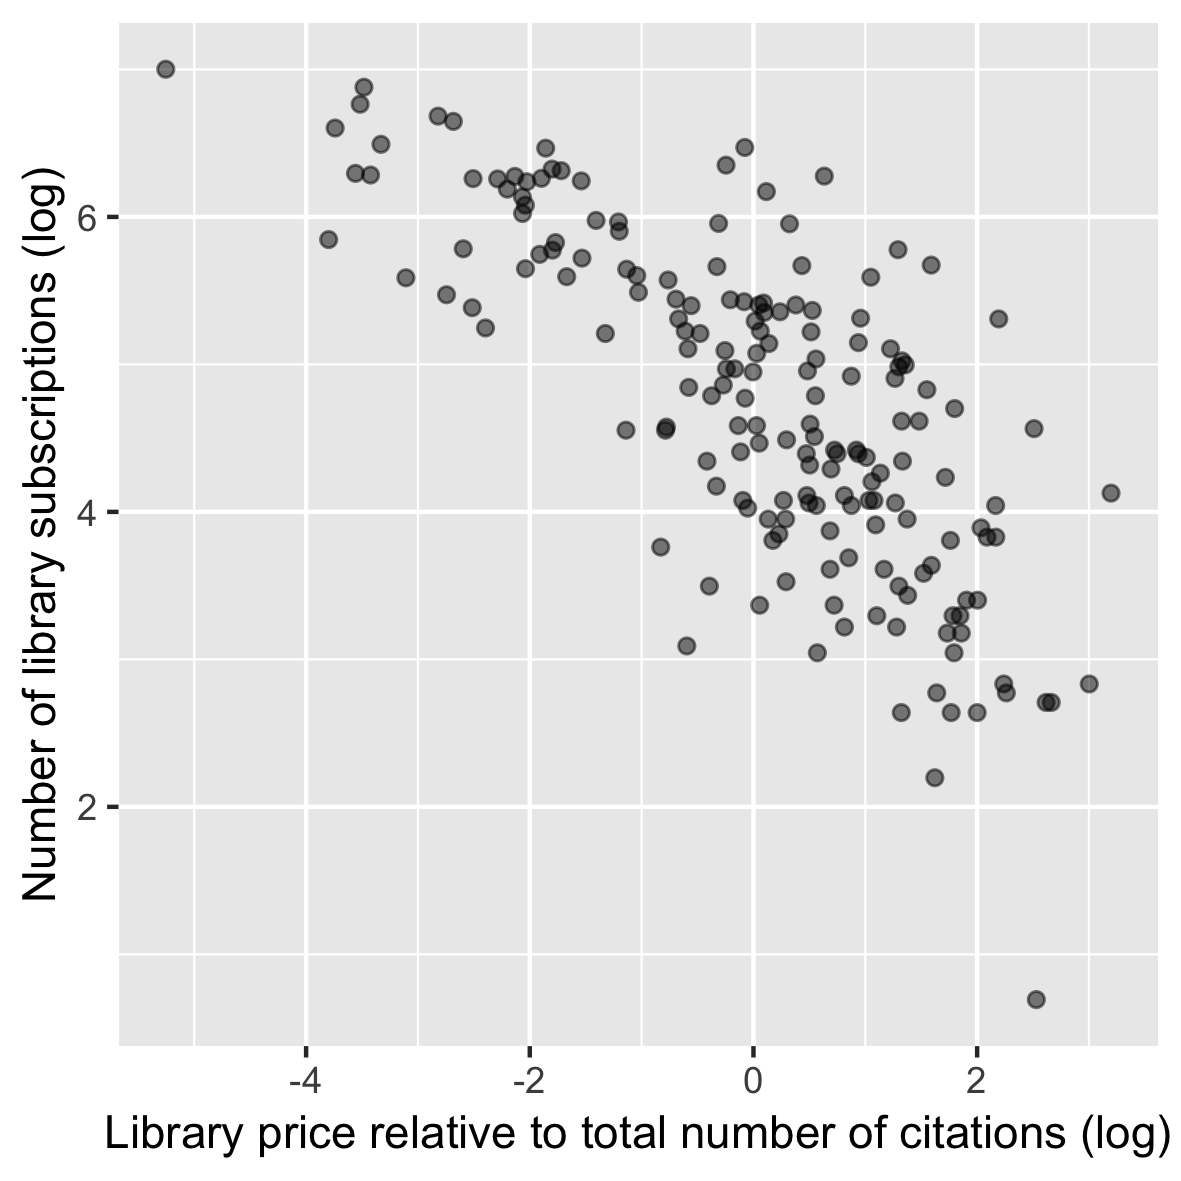
Heteroscedasticity से निपटना

library(AER)
data(Journals)

p <- ggplot(Journals, 
            aes(log(price/citations), 
                log(subs))) +
  geom_point(alpha = 0.5) +
  labs(...)

p

इंटरमीडिएट Data Visualization with ggplot2

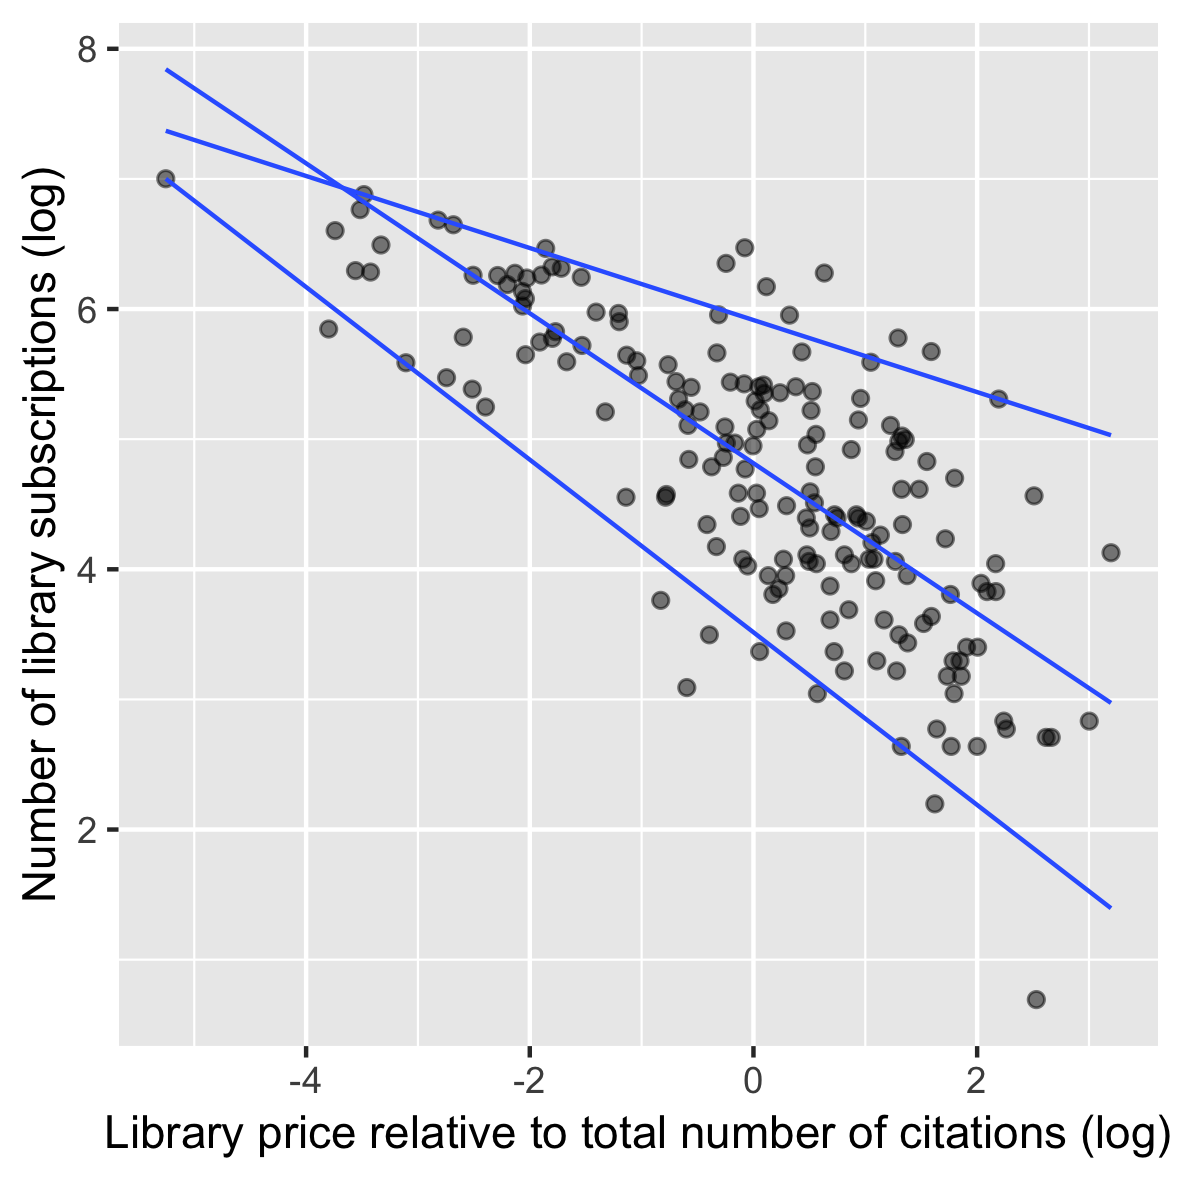
geom_quantiles का उपयोग

p +
  geom_quantile(quantiles = 
                c(0.05, 0.50, 0.95))

इंटरमीडिएट Data Visualization with ggplot2

geom/stat कनेक्शन

geom_ stat_
geom_count() stat_sum()
geom_quantile() stat_quantile()
इंटरमीडिएट Data Visualization with ggplot2

अभ्यास के लिए तैयार!

इंटरमीडिएट Data Visualization with ggplot2

Preparing Video For Download...