pandas के साथ expanding window functions

Python में Time Series डेटा मैनिपुलेट करना

Stefan Jansen

Founder & Lead Data Scientist at Applied Artificial Intelligence

pandas में expanding windows

  • Rolling से expanding windows तक
  • वर्तमान तारीख तक की अवधियों के लिए मेट्रिक्स निकालें
  • नई टाइम सीरीज़ में सभी ऐतिहासिक मान दिखते हैं
  • रनिंग रेट ऑफ रिटर्न, रनिंग min/max के लिए उपयोगी
  • pandas में दो तरीके:
    • .expanding() - बिलकुल .rolling() जैसा
    • .cumsum(), .cumprod(), cummin()/max()
Python में Time Series डेटा मैनिपुलेट करना

मूल विचार

df = pd.DataFrame({'data': range(5)})

df['expanding sum'] = df.data.expanding().sum()
df['cumulative sum'] = df.data.cumsum()
df
   data  expanding sum  cumulative sum
0     0            0.0               0
1     1            1.0               1
2     2            3.0               3
3     3            6.0               6
4     4           10.0              10
Python में Time Series डेटा मैनिपुलेट करना

S&P 500 का डेटा लें

data = pd.read_csv('sp500.csv', parse_dates=['date'], index_col='date')
DatetimeIndex: 2519 entries, 2007-05-24 to 2017-05-24
Data columns (total 1 columns):
SP500    2519 non-null float64
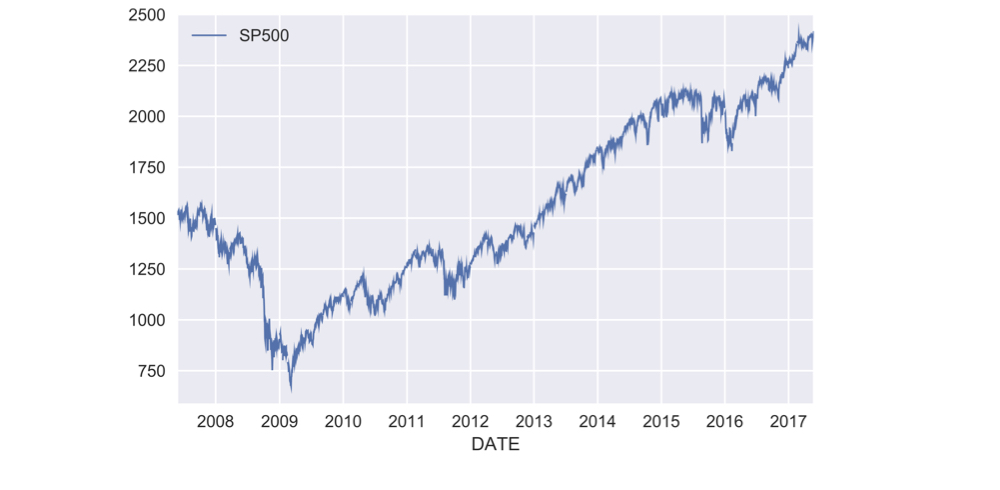
ch3_2_v2 - Expanding Window Functions with Pandas.013.png

Python में Time Series डेटा मैनिपुलेट करना

Running return कैसे निकालें

  • सिंगल पीरियड रिटर्न $r_t$: वर्तमान कीमत ÷ पिछली कीमत, फिर 1 घटाएँ:

    $$r_t = \frac{P_t}{P_{t-1}} - 1$$

    • मल्टी-पीरियड रिटर्न: सभी अवधियों के लिए $(1 + r_t)$ का गुणनफल, फिर 1 घटाएँ:

    $$R_T = (1 + r_1)(1 + r_2)...(1 + r_T) - 1$$

    • पीरियड रिटर्न के लिए: .pct_change()
    • बेसिक गणित के लिए .add(), .sub(), .mul(), .div()
    • cumulative product के लिए: .cumprod()
Python में Time Series डेटा मैनिपुलेट करना

व्यवहार में running rate of return

pr = data.SP500.pct_change() # period return

pr_plus_one = pr.add(1)
cumulative_return = pr_plus_one.cumprod().sub(1)
cumulative_return.mul(100).plot()

ch3_2_v2 - Expanding Window Functions with Pandas.021.png

Python में Time Series डेटा मैनिपुलेट करना

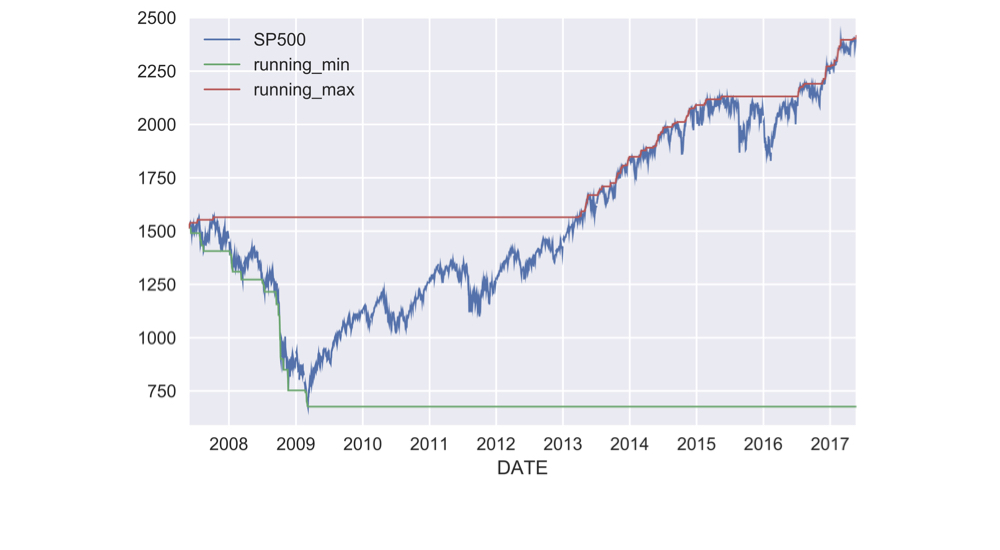
Running min और max पाना

data['running_min'] = data.SP500.expanding().min()

data['running_max'] = data.SP500.expanding().max()
data.plot()

ch3_2_v2 - Expanding Window Functions with Pandas.023.png

Python में Time Series डेटा मैनिपुलेट करना

Rolling वार्षिक rate of return

def multi_period_return(period_returns):
    return np.prod(period_returns + 1) - 1

pr = data.SP500.pct_change() # period return
r = pr.rolling('360D').apply(multi_period_return)
data['Rolling 1yr Return'] = r.mul(100)
data.plot(subplots=True)
Python में Time Series डेटा मैनिपुलेट करना

Rolling वार्षिक rate of return

data['Rolling 1yr Return'] = r.mul(100)

data.plot(subplots=True)

ch3_2_v2 - Expanding Window Functions with Pandas.027.png

Python में Time Series डेटा मैनिपुलेट करना

अभ्यास करते हैं!

Python में Time Series डेटा मैनिपुलेट करना

Preparing Video For Download...