इंडेक्स कोरिलेशन और Excel में एक्सपोर्ट

Python में Time Series डेटा मैनिपुलेट करना

Stefan Jansen

Founder & Lead Data Scientist at Applied Artificial Intelligence

अपने इंडेक्स का कुछ अतिरिक्त विश्लेषण

  • डेली रिटर्न कोरिलेशन:

  • सभी कॉम्पोनेंट्स के बीच कैलकुलेट करें

  • रिजल्ट को हीटमैप के रूप में विज़ुअलाइज़ करें

  • रिजल्ट्स को .xls और .xlsx फॉर्मैट में Excel पर लिखें:

  • सिंगल वर्कशीट

  • मल्टिपल वर्कशीट्स

Python में Time Series डेटा मैनिपुलेट करना

इंडेक्स कॉम्पोनेंट्स - प्राइस डेटा

data = DataReader(tickers, 'google', start='2016', end='2017')['Close']

data.info()
DatetimeIndex: 252 entries, 2016-01-04 to 2016-12-30
Data columns (total 12 columns):
ABB     252 non-null float64
BABA    252 non-null float64
JNJ     252 non-null float64
JPM     252 non-null float64
KO      252 non-null float64
ORCL    252 non-null float64
PG      252 non-null float64
T       252 non-null float64
TM      252 non-null float64
UPS     252 non-null float64
WMT     252 non-null float64
XOM     252 non-null float64
Python में Time Series डेटा मैनिपुलेट करना

इंडेक्स कॉम्पोनेंट्स: रिटर्न कोरिलेशन

daily_returns = data.pct_change()

correlations = daily_returns.corr()
ABB  BABA  JNJ  JPM   KO  ORCL   PG    T   TM  UPS  WMT  XOM
ABB  1.00  0.40 0.33 0.56 0.31  0.53 0.34 0.29 0.48 0.50 0.15 0.48
BABA 0.40  1.00 0.27 0.27 0.25  0.38 0.21 0.17 0.34 0.35 0.13 0.21
JNJ  0.33  0.27 1.00 0.34 0.30  0.37 0.42 0.35 0.29 0.45 0.24 0.41
JPM  0.56  0.27 0.34 1.00 0.22  0.57 0.27 0.13 0.49 0.56 0.14 0.48
KO   0.31  0.25 0.30 0.22 1.00  0.31 0.62 0.47 0.33 0.50 0.25 0.29
ORCL 0.53  0.38 0.37 0.57 0.31  1.00 0.41 0.32 0.48 0.54 0.21 0.42
PG   0.34  0.21 0.42 0.27 0.62  0.41 1.00 0.43 0.32 0.47 0.33 0.34
T    0.29  0.17 0.35 0.13 0.47  0.32 0.43 1.00 0.28 0.41 0.31 0.33
TM   0.48  0.34 0.29 0.49 0.33  0.48 0.32 0.28 1.00 0.52 0.20 0.30
UPS  0.50  0.35 0.45 0.56 0.50  0.54 0.47 0.41 0.52 1.00 0.33 0.45
WMT  0.15  0.13 0.24 0.14 0.25  0.21 0.33 0.31 0.20 0.33 1.00 0.21
XOM  0.48  0.21 0.41 0.48 0.29  0.42 0.34 0.33 0.30 0.45 0.21 1.00
Python में Time Series डेटा मैनिपुलेट करना

इंडेक्स कॉम्पोनेंट्स: रिटर्न कोरिलेशन

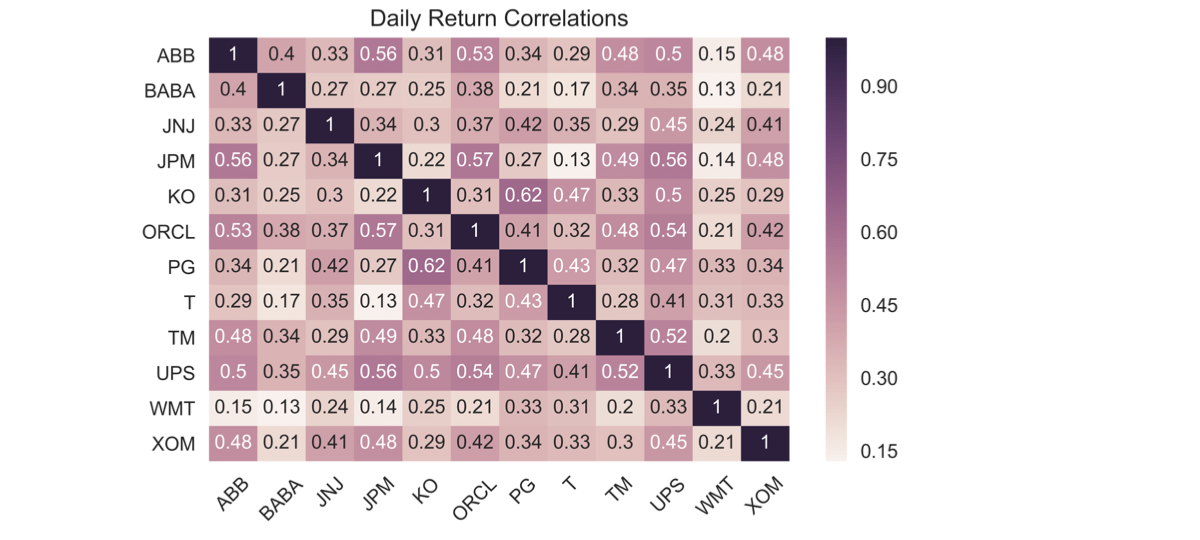
sns.heatmap(correlations, annot=True)
plt.xticks(rotation=45)
plt.title('Daily Return Correlations')
ch4_4_v2 - Index Correlation & Saving Results to Excel.010.png

Python में Time Series डेटा मैनिपुलेट करना

एक ही Excel वर्कशीट में सेव करना

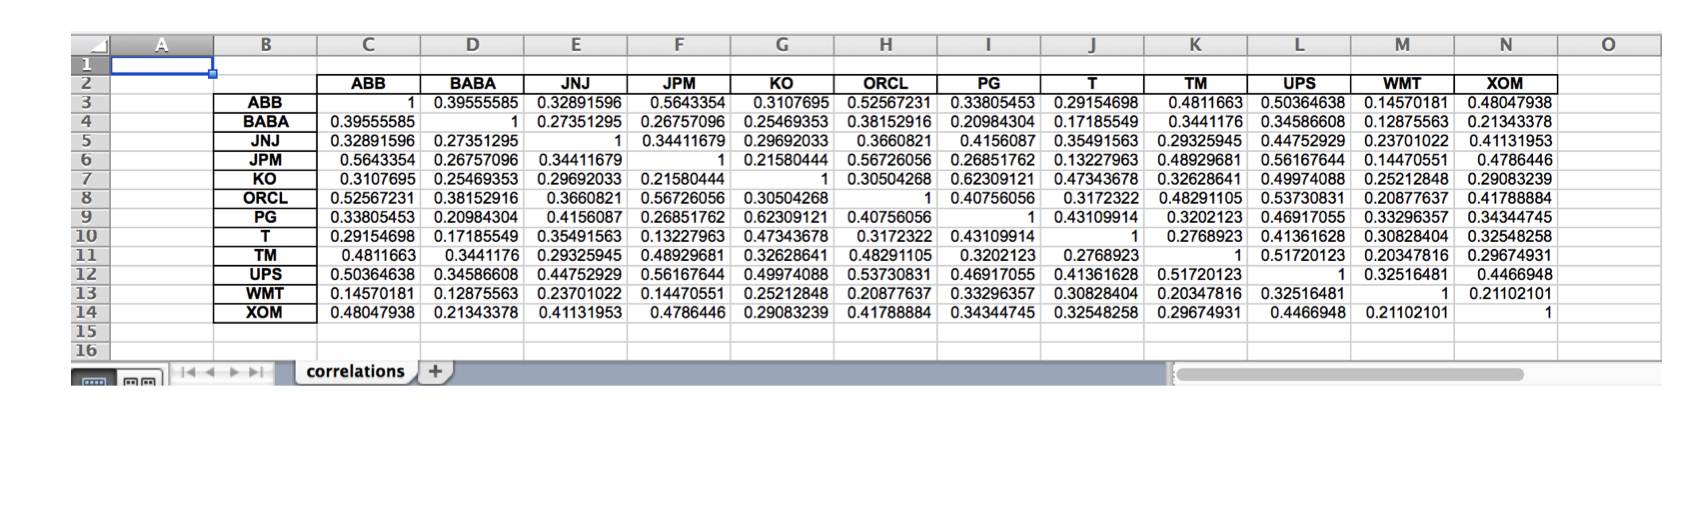
correlations.to_excel(excel_writer= 'correlations.xls',
                      sheet_name='correlations',
                      startrow=1,
                      startcol=1)
ch4_4_v2 - Index Correlation & Saving Results to Excel.012.png

Python में Time Series डेटा मैनिपुलेट करना

कई Excel वर्कशीट्स में सेव करना

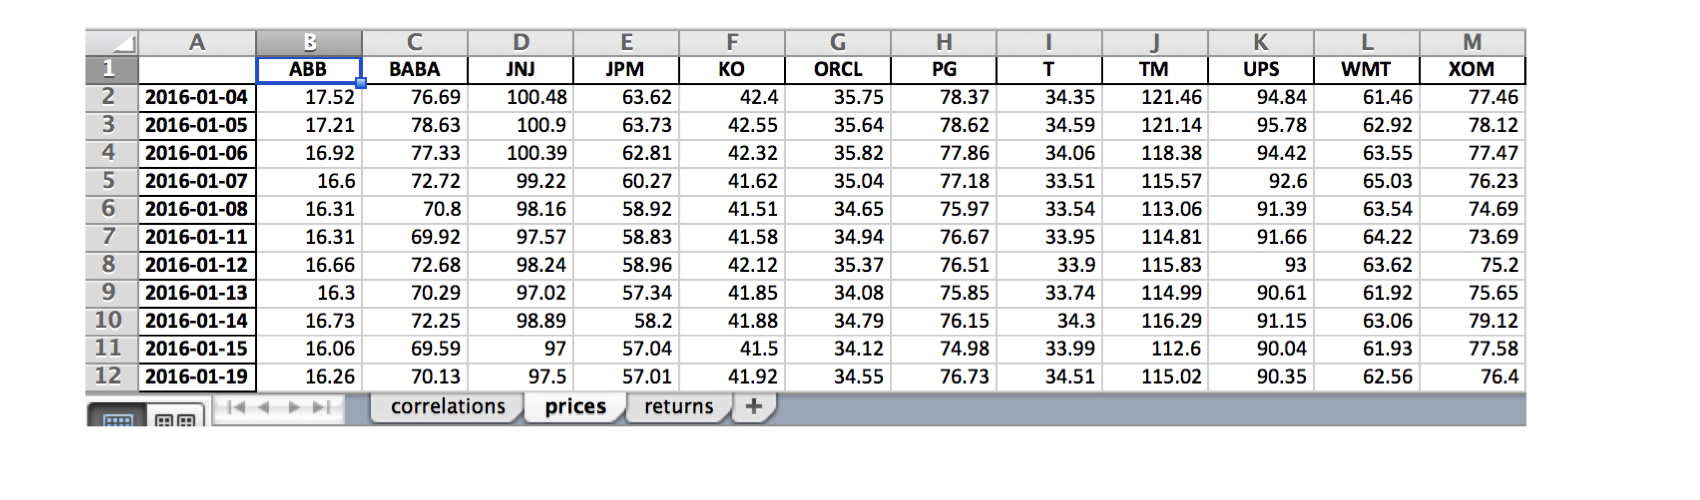
data.index = data.index.date # केवल तिथि भाग रखें

with pd.ExcelWriter('stock_data.xlsx') as writer:
corr.to_excel(excel_writer=writer, sheet_name='correlations')
data.to_excel(excel_writer=writer, sheet_name='prices')
data.pct_change().to_excel(writer, sheet_name='returns')
ch4_4_v2 - Index Correlation & Saving Results to Excel.015.png

Python में Time Series डेटा मैनिपुलेट करना

अभ्यास करते हैं!

Python में Time Series डेटा मैनिपुलेट करना

Preparing Video For Download...