pandas के साथ रोलिंग विंडो फ़ंक्शंस

Python में Time Series डेटा मैनिपुलेट करना

Stefan Jansen

Founder & Lead Data Scientist at Applied Artificial Intelligence

pandas में Window functions

  • Windows आपकी time series के उप-कालखंड पहचानते हैं
  • विंडो के अंदर उप-कालखंडों के लिए metrics निकालें
  • इन metrics की नई time series बनाएँ
  • विंडो के दो प्रकार:
    • Rolling: समान आकार, स्लाइडिंग (यह वीडियो)
    • Expanding: सभी पूर्व मान शामिल (अगला वीडियो)
Python में Time Series डेटा मैनिपुलेट करना

Rolling average की गणना

data = pd.read_csv('google.csv', parse_dates=['date'], index_col='date')
DatetimeIndex: 1761 entries, 2010-01-04 to 2016-12-30
Data columns (total 1 columns):
price     1761 non-null float64
dtypes: float64(1)

ch3_1_v2 - Rolling Window Functions with Pandas.010.png

Python में Time Series डेटा मैनिपुलेट करना

Rolling average की गणना

# Integer-आधारित window size
data.rolling(window=30).mean() # निश्चित # observations
DatetimeIndex: 1761 entries, 2010-01-04 to 2017-05-24
Data columns (total 1 columns):
price    1732 non-null float64
dtypes: float64(1)
  • window=30: # business days
  • min_periods: शुरुआती दिनों के लिए 30 से कम मान चुनें
Python में Time Series डेटा मैनिपुलेट करना

Rolling average की गणना

# Offset-आधारित window size
data.rolling(window='30D').mean() # fixed period length
DatetimeIndex: 1761 entries, 2010-01-04 to 2017-05-24
Data columns (total 1 columns):
price    1761 non-null float64
dtypes: float64(1)
  • 30D: # calendar days
Python में Time Series डेटा मैनिपुलेट करना

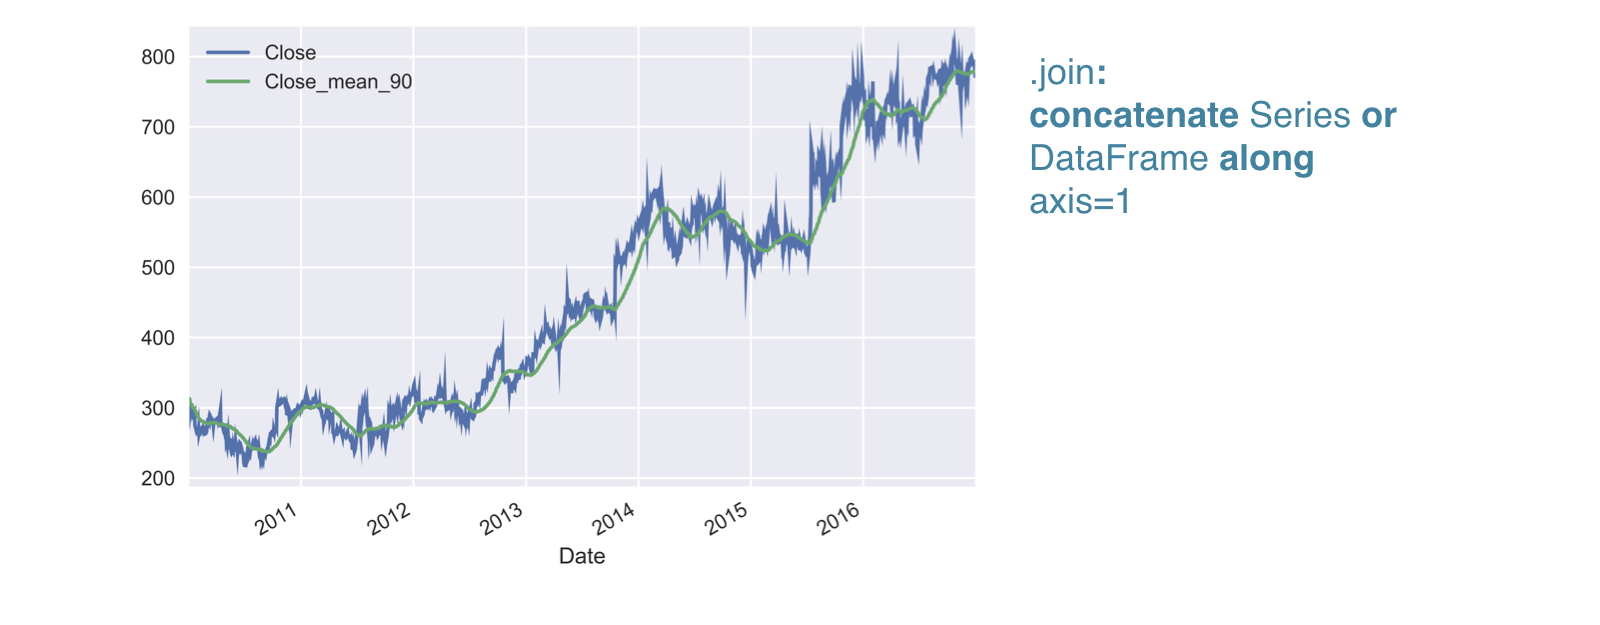
90 दिन की rolling mean

r90 = data.rolling(window='90D').mean()

google.join(r90.add_suffix('_mean_90')).plot()
ch3_1_v2 - Rolling Window Functions with Pandas.017.png

Python में Time Series डेटा मैनिपुलेट करना

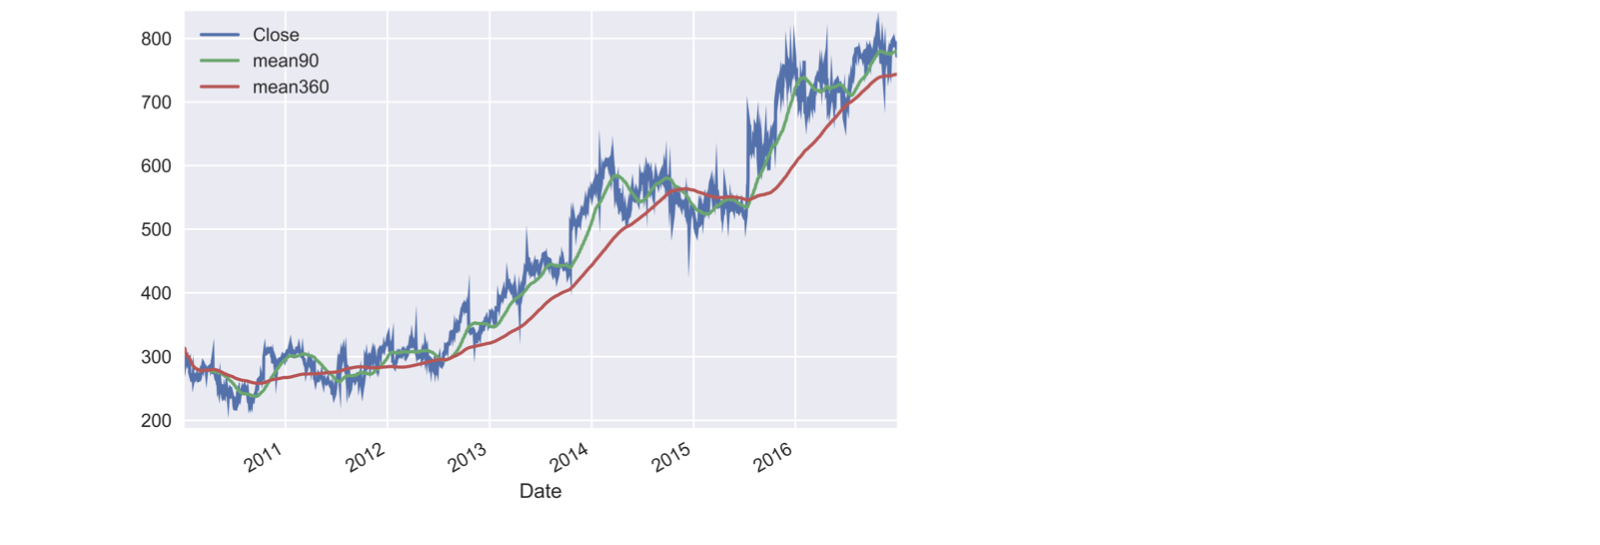
90 और 360 दिन की rolling means

data['mean90'] = r90

r360 = data['price'].rolling(window='360D'.mean()
data['mean360'] = r360; data.plot()

ch3_1_v2 - Rolling Window Functions with Pandas.020.png

Python में Time Series डेटा मैनिपुलेट करना

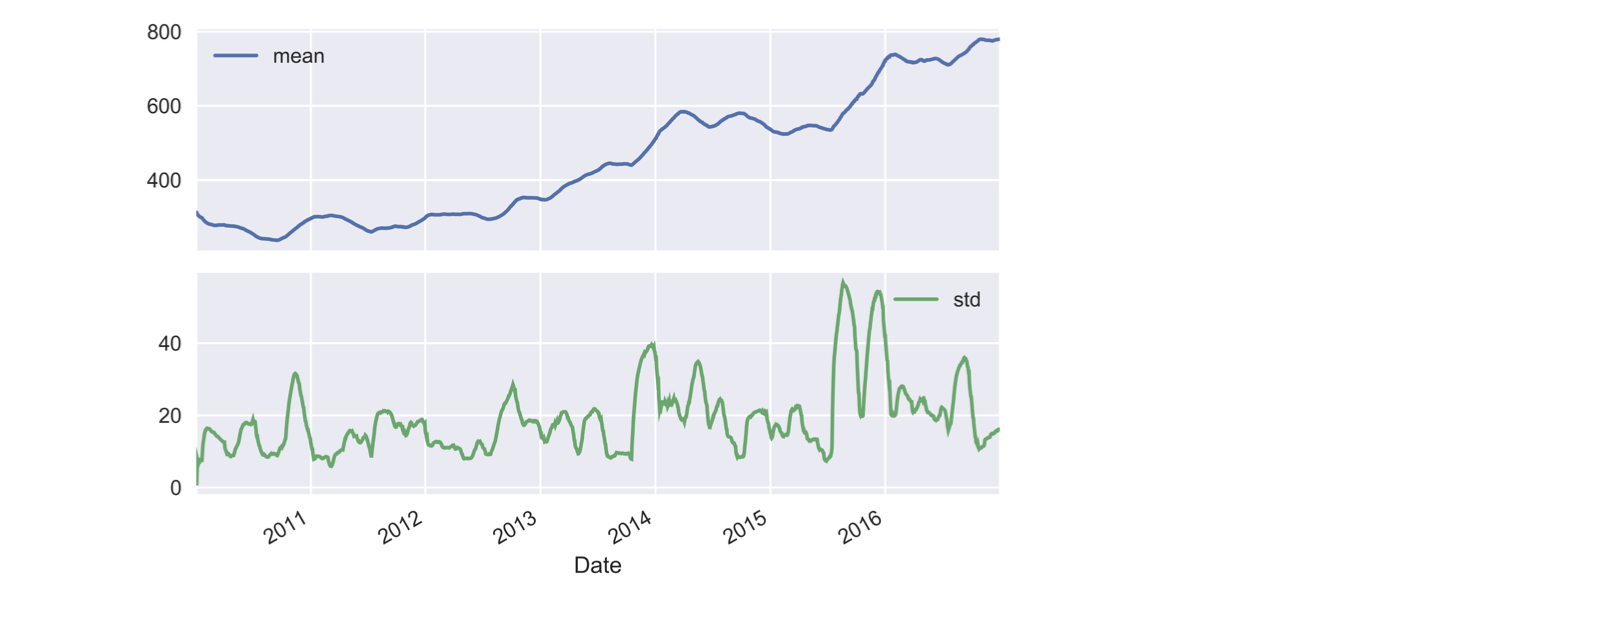
एकाधिक rolling metrics (1)

r = data.price.rolling('90D').agg(['mean', 'std'])

r.plot(subplots = True)

ch3_1_v2 - Rolling Window Functions with Pandas.022.png

Python में Time Series डेटा मैनिपुलेट करना

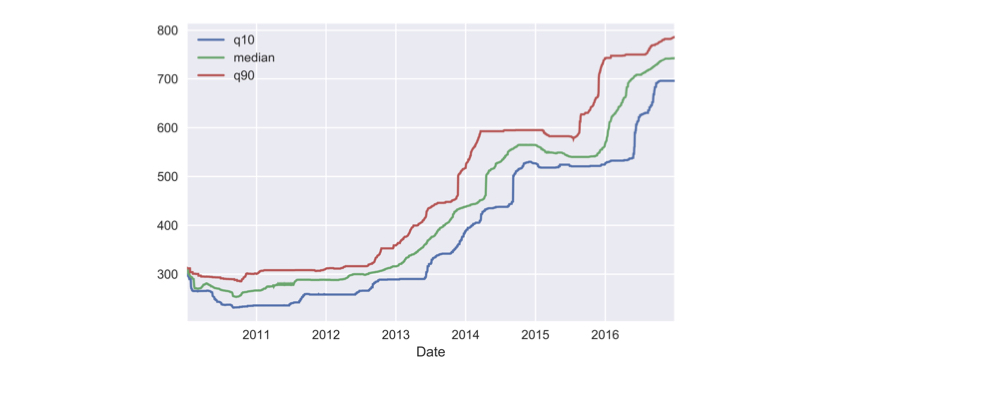
एकाधिक rolling metrics (2)

rolling = data.google.rolling('360D')

q10 = rolling.quantile(0.1).to_frame('q10')
median = rolling.median().to_frame('median')
q90 = rolling.quantile(0.9).to_frame('q90')
pd.concat([q10, median, q90], axis=1).plot()
ch3_1_v2 - Rolling Window Functions with Pandas.024.png

Python में Time Series डेटा मैनिपुलेट करना

अभ्यास करते हैं!

Python में Time Series डेटा मैनिपुलेट करना

Preparing Video For Download...