Python में Time Series डेटा मैनिपुलेट करना
Stefan Jansen
Founder & Lead Data Scientist at Applied Artificial Intelligence
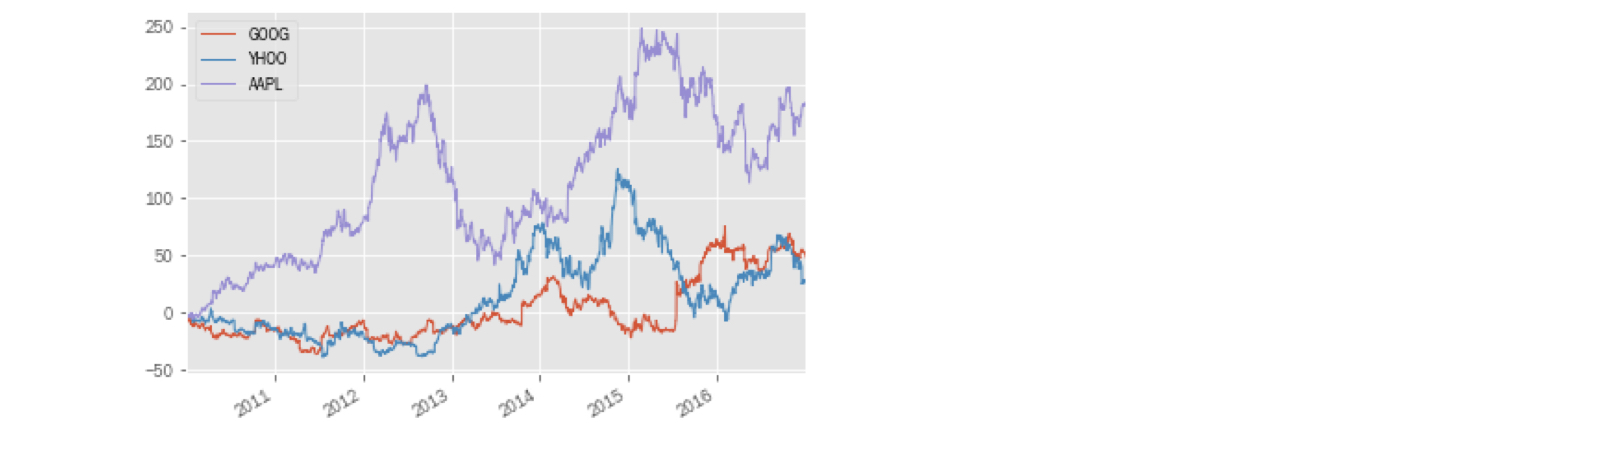
स्टॉक प्राइस सीरीज़: अलग स्तरों पर तुलना करना मुश्किल
सरल उपाय: प्राइस सीरीज़ को 100 से शुरू होने पर नॉर्मलाइज़ करें
सभी प्राइस को सीरीज़ की पहली वैल्यू से भाग दें, फिर 100 से गुणा करें
एक जैसा शुरुआती बिंदु
सभी प्राइस शुरुआती बिंदु के सापेक्ष
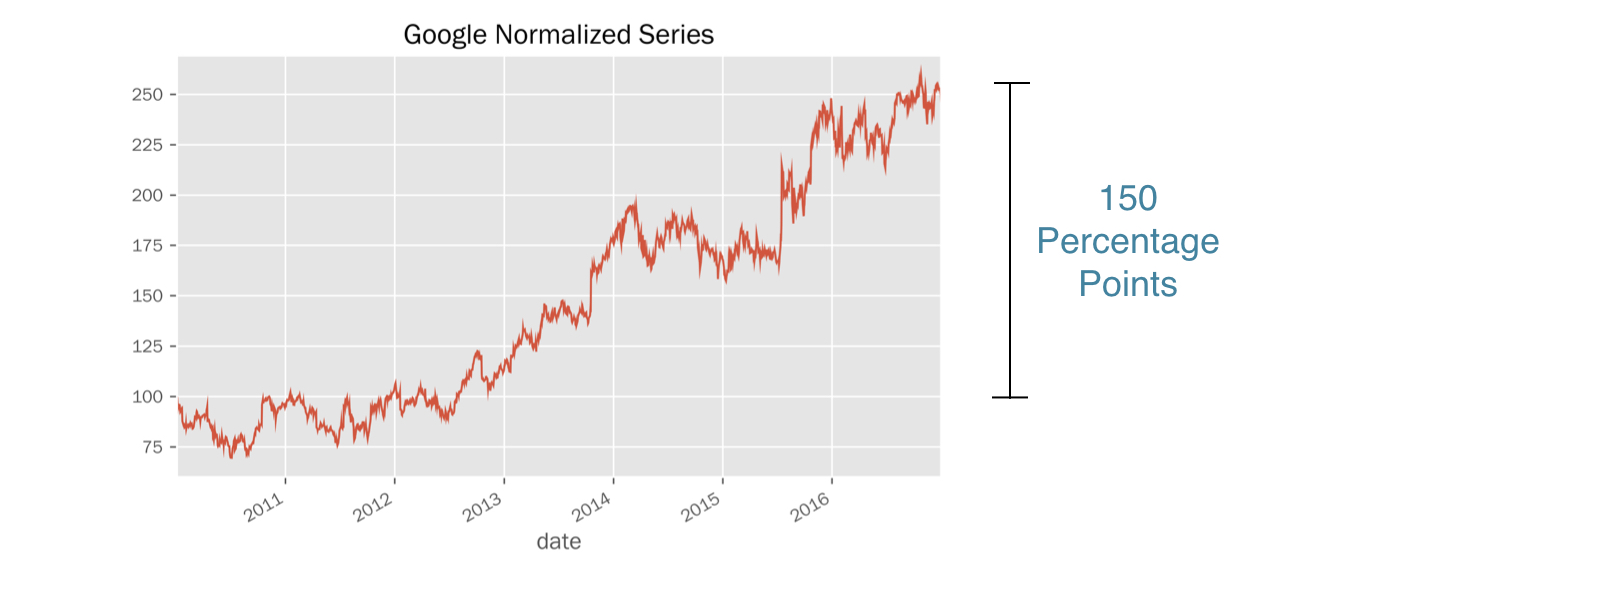
शुरुआती बिंदु से फर्क प्रतिशत पॉइंट्स में
google = pd.read_csv('google.csv', parse_dates=['date'], index_col='date')google.head(3)
price
date
2010-01-04 313.06
2010-01-05 311.68
2010-01-06 303.83
first_price = google.price.iloc[0] # int-based selectionfirst_price
313.06
first_price == google.loc['2010-01-04', 'price']
True
normalized = google.price.div(first_price).mul(100)normalized.plot(title='Google Normalized Series')
prices = pd.read_csv('stock_prices.csv', parse_dates=['date'], index_col='date')prices.info()
DatetimeIndex: 1761 entries, 2010-01-04 to 2016-12-30
Data columns (total 3 columns):
AAPL 1761 non-null float64
GOOG 1761 non-null float64
YHOO 1761 non-null float64
dtypes: float64(3)
prices.head(2)
AAPL GOOG YHOO
Date
2010-01-04 30.57 313.06 17.10
2010-01-05 30.63 311.68 17.23
prices.iloc[0]
AAPL 30.57
GOOG 313.06
YHOO 17.10
Name: 2010-01-04 00:00:00, dtype: float64
normalized = prices.div(prices.iloc[0])normalized.head(3)
AAPL GOOG YHOO
Date
2010-01-04 1.000000 1.000000 1.000000
2010-01-05 1.001963 0.995592 1.007602
2010-01-06 0.985934 0.970517 1.004094
.div(): Series के index और DataFrame के columns अपने-आप align होते हैंindex = pd.read_csv('benchmark.csv', parse_dates=['date'], index_col='date')index.info()
DatetimeIndex: 1826 entries, 2010-01-01 to 2016-12-30
Data columns (total 1 columns):
SP500 1762 non-null float64
dtypes: float64(1)
prices = pd.concat([prices, index], axis=1).dropna()prices.info()
DatetimeIndex: 1761 entries, 2010-01-04 to 2016-12-30
Data columns (total 4 columns):
AAPL 1761 non-null float64
GOOG 1761 non-null float64
YHOO 1761 non-null float64
SP500 1761 non-null float64
dtypes: float64(4)
prices.head(1)
AAPL GOOG YHOO SP500
2010-01-04 30.57 313.06 17.10 1132.99
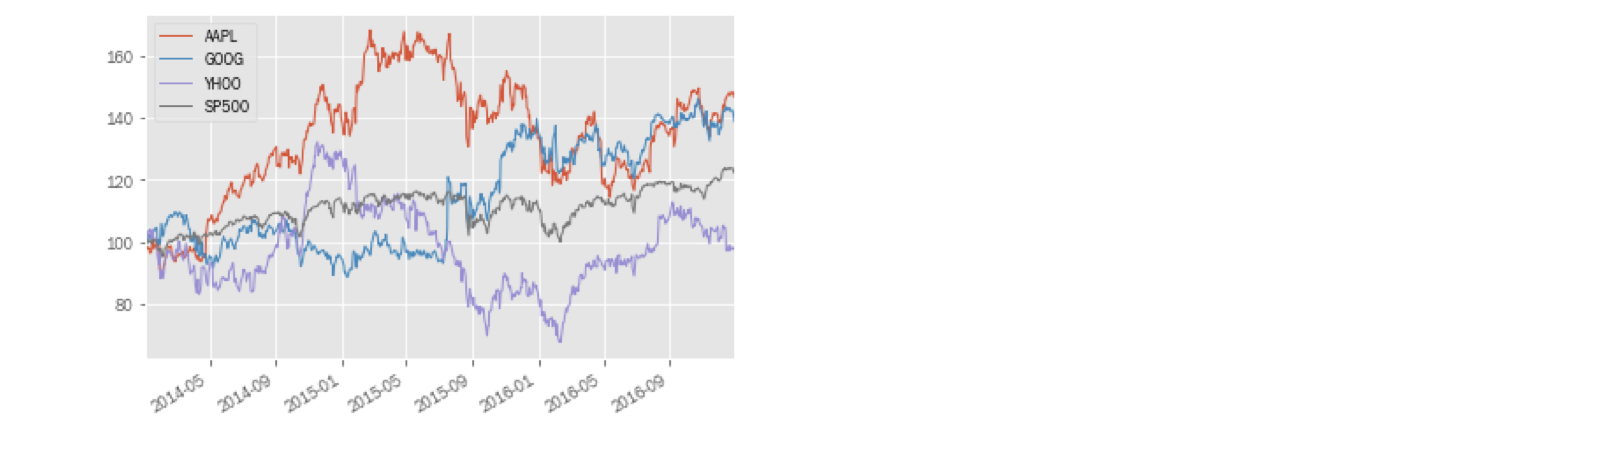
normalized = prices.div(prices.iloc[0]).mul(100)normalized.plot()
diff = normalized[tickers].sub(normalized['SP500'], axis=0)
GOOG YHOO AAPL
2010-01-04 0.000000 0.000000 0.000000
2010-01-05 -0.752375 0.448669 -0.115294
2010-01-06 -3.314604 0.043069 -1.772895
.sub(..., axis=0): Series को indexes से align करके हर DataFrame कॉलम से घटाएँdiff.plot()

Python में Time Series डेटा मैनिपुलेट करना