क्लस्टर विश्लेषण की बुनियाद

Python में क्लस्टर विश्लेषण

Shaumik Daityari

Business Analyst

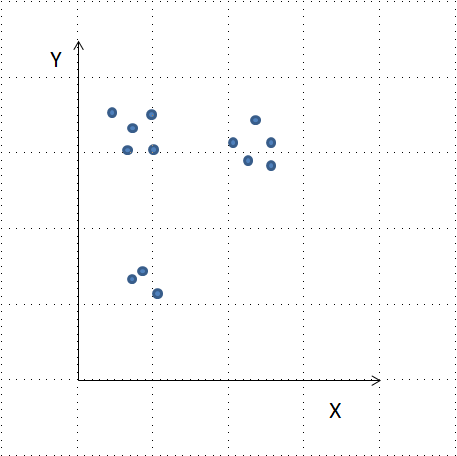
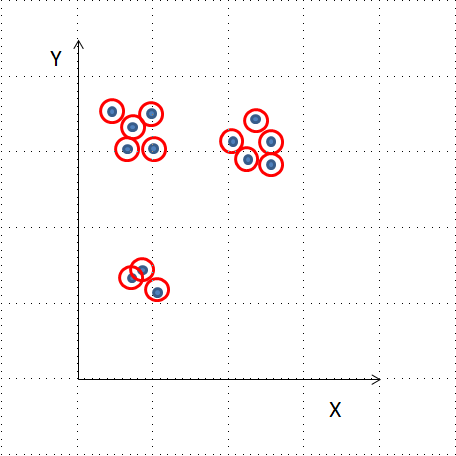
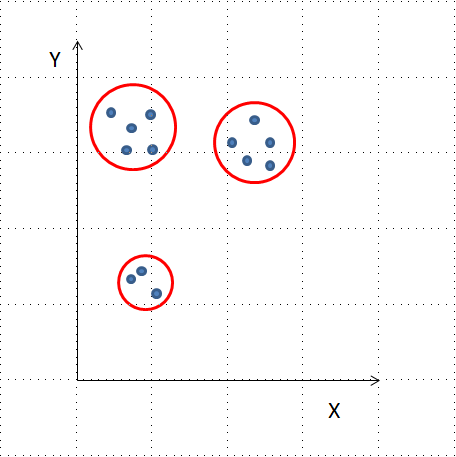
क्लस्टर क्या है?

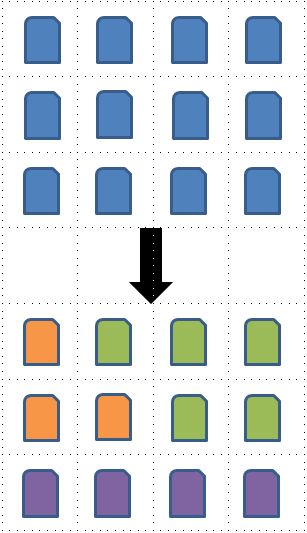
  • समान विशेषताओं वाली आइटमों का समूह
  • Google News: जहाँ मिलते-जुलते शब्द और शब्द-संबंध साथ दिखें
  • कस्टमर सेगमेंट्स

Python में क्लस्टर विश्लेषण

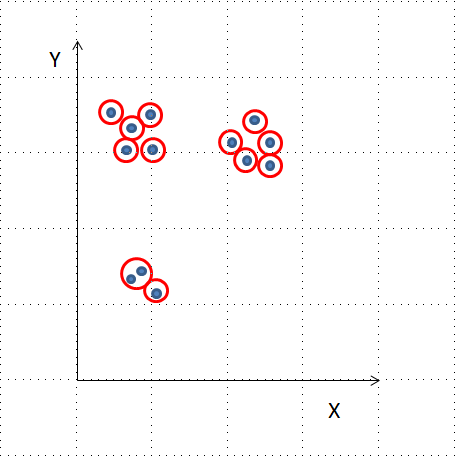
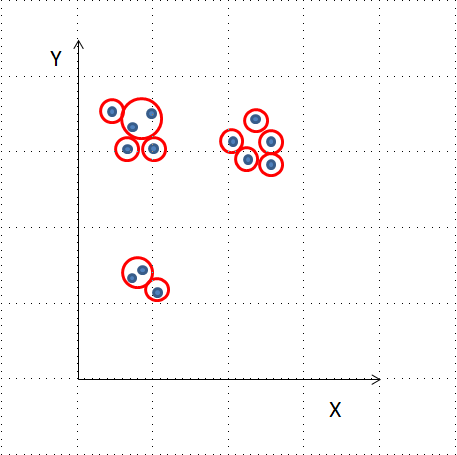
क्लस्टरिंग एल्गोरिदम

  • हायअरार्किकल क्लस्टरिंग
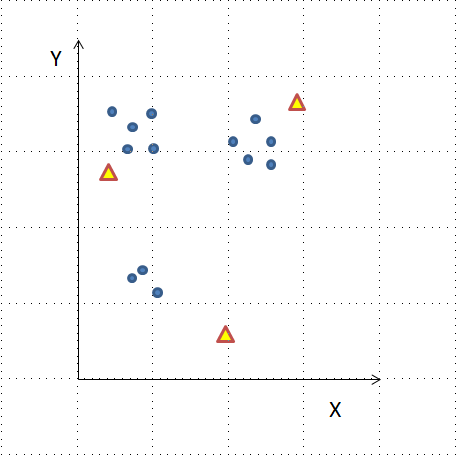
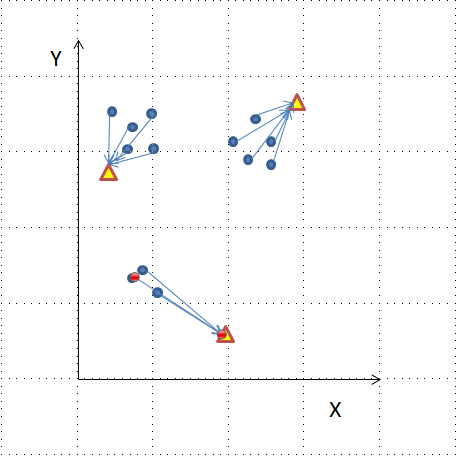
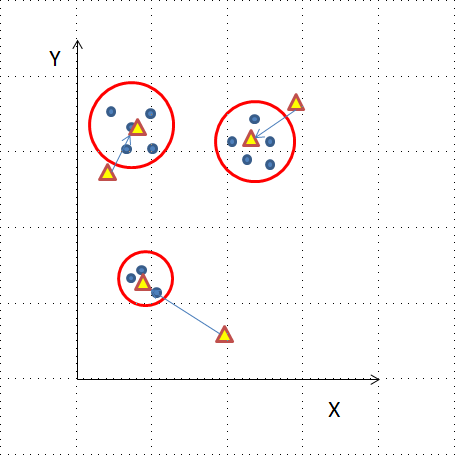
  • K-means क्लस्टरिंग
  • अन्य क्लस्टरिंग एल्गोरिदम: DBSCAN, Gaussian मेथड्स
Python में क्लस्टर विश्लेषण

Python में क्लस्टर विश्लेषण

Python में क्लस्टर विश्लेषण

Python में क्लस्टर विश्लेषण

Python में क्लस्टर विश्लेषण

Python में क्लस्टर विश्लेषण

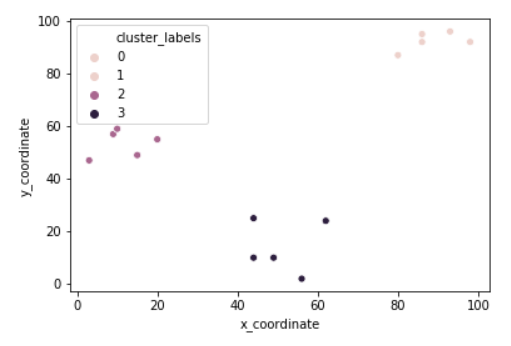
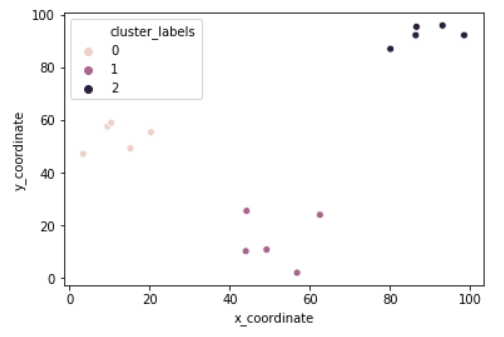
SciPy में हायअरार्किकल क्लस्टरिंग

from scipy.cluster.hierarchy import linkage, fcluster
from matplotlib import pyplot as plt
import seaborn as sns, pandas as pd
x_coordinates = [80.1, 93.1, 86.6, 98.5, 86.4, 9.5, 15.2, 3.4, 
                 10.4, 20.3, 44.2, 56.8, 49.2, 62.5, 44.0]
y_coordinates = [87.2, 96.1, 95.6, 92.4, 92.4, 57.7, 49.4, 
                 47.3, 59.1, 55.5, 25.6, 2.1, 10.9, 24.1, 10.3]

df = pd.DataFrame({'x_coordinate': x_coordinates,
                   'y_coordinate': y_coordinates})
Z = linkage(df, 'ward')
df['cluster_labels'] = fcluster(Z, 3, criterion='maxclust')
sns.scatterplot(x='x_coordinate', y='y_coordinate', 
                hue='cluster_labels', data = df)
plt.show()
Python में क्लस्टर विश्लेषण

Python में क्लस्टर विश्लेषण

Python में क्लस्टर विश्लेषण

Python में क्लस्टर विश्लेषण

Python में क्लस्टर विश्लेषण

Python में क्लस्टर विश्लेषण

SciPy में K-means क्लस्टरिंग

from scipy.cluster.vq import kmeans, vq
from matplotlib import pyplot as plt
import seaborn as sns, pandas as pd

import random
random.seed((1000,2000))
x_coordinates = [80.1, 93.1, 86.6, 98.5, 86.4, 9.5, 15.2, 3.4, 
                 10.4, 20.3, 44.2, 56.8, 49.2, 62.5, 44.0]
y_coordinates = [87.2, 96.1, 95.6, 92.4, 92.4, 57.7, 49.4, 
                 47.3, 59.1, 55.5, 25.6, 2.1, 10.9, 24.1, 10.3]

df = pd.DataFrame({'x_coordinate': x_coordinates, 'y_coordinate': y_coordinates})
centroids,_ = kmeans(df, 3)
df['cluster_labels'], _ = vq(df, centroids)
sns.scatterplot(x='x_coordinate', y='y_coordinate', 
                hue='cluster_labels', data = df)
plt.show()
Python में क्लस्टर विश्लेषण

Python में क्लस्टर विश्लेषण

अब आगे: हैंड्स-ऑन अभ्यास

Python में क्लस्टर विश्लेषण

Preparing Video For Download...