Dash और Plotly के साथ डैशबोर्ड बनाना
Alex Scriven
Data Scientist
$$
from dash import Input, Output
component_id
component_property
@callback(

   Output(component_id='my_plot',
          component_property='figure'),

   Input(component_id='my_input',
          component_property='value')

)

def some_function(data):
    # Subset Data
    # Recreate Figure
    return fig
@callback(
Output(component_id='my_plot', component_property='figure'),
Input(component_id='my_input', component_property='value')
)
def some_function(data): # Subset Data # Recreate Figure return fig
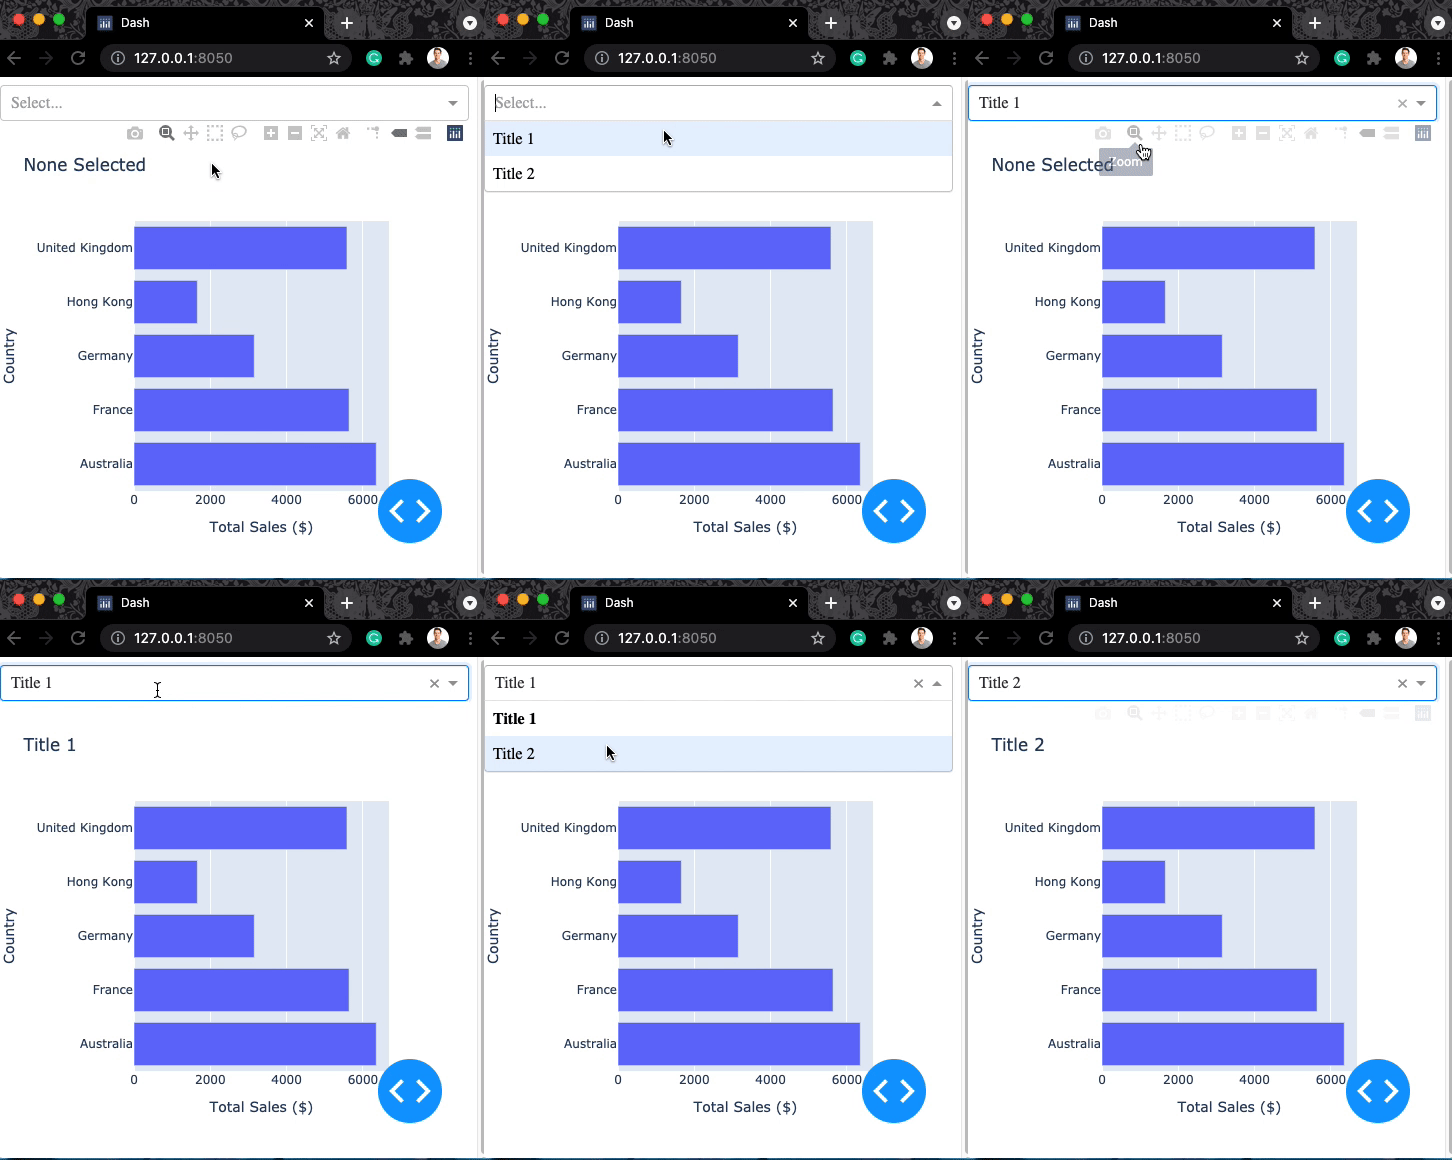
dcc.Dropdown(id='title_dd',
             options=['Title 1', 'Title 2'])
app.layout =[

  dcc.Dropdown(id='title_dd',
      options=['Title 1', 'Title 2']),

  dcc.Graph(id='my_graph')])

@callback(
    Output(component_id='my_graph',
           component_property='figure'),

    Input(component_id='title_dd',
           component_property='value')
)
app.layout =[
dcc.Dropdown(id='title_dd', options=['Title 1', 'Title 2']),
dcc.Graph(id='my_graph')])
@callback( Output(component_id='my_graph', component_property='figure'),
Input(component_id='title_dd', component_property='value') )
# @callback()
def update_plot(selection):
    title = "None Selected"
    if selection:
        title = selection

    bar_fig = px.bar(
      data_frame=ecom_sales,
      title=f'{title}',
      x='Total Sales ($)', y='Country')

  return bar_fig
# @callback() def update_plot(selection): title = "None Selected" if selection: title = selection
bar_fig = px.bar( data_frame=ecom_sales, title=f'{title}', x='Total Sales ($)', y='Country')
return bar_fig
# @callback()
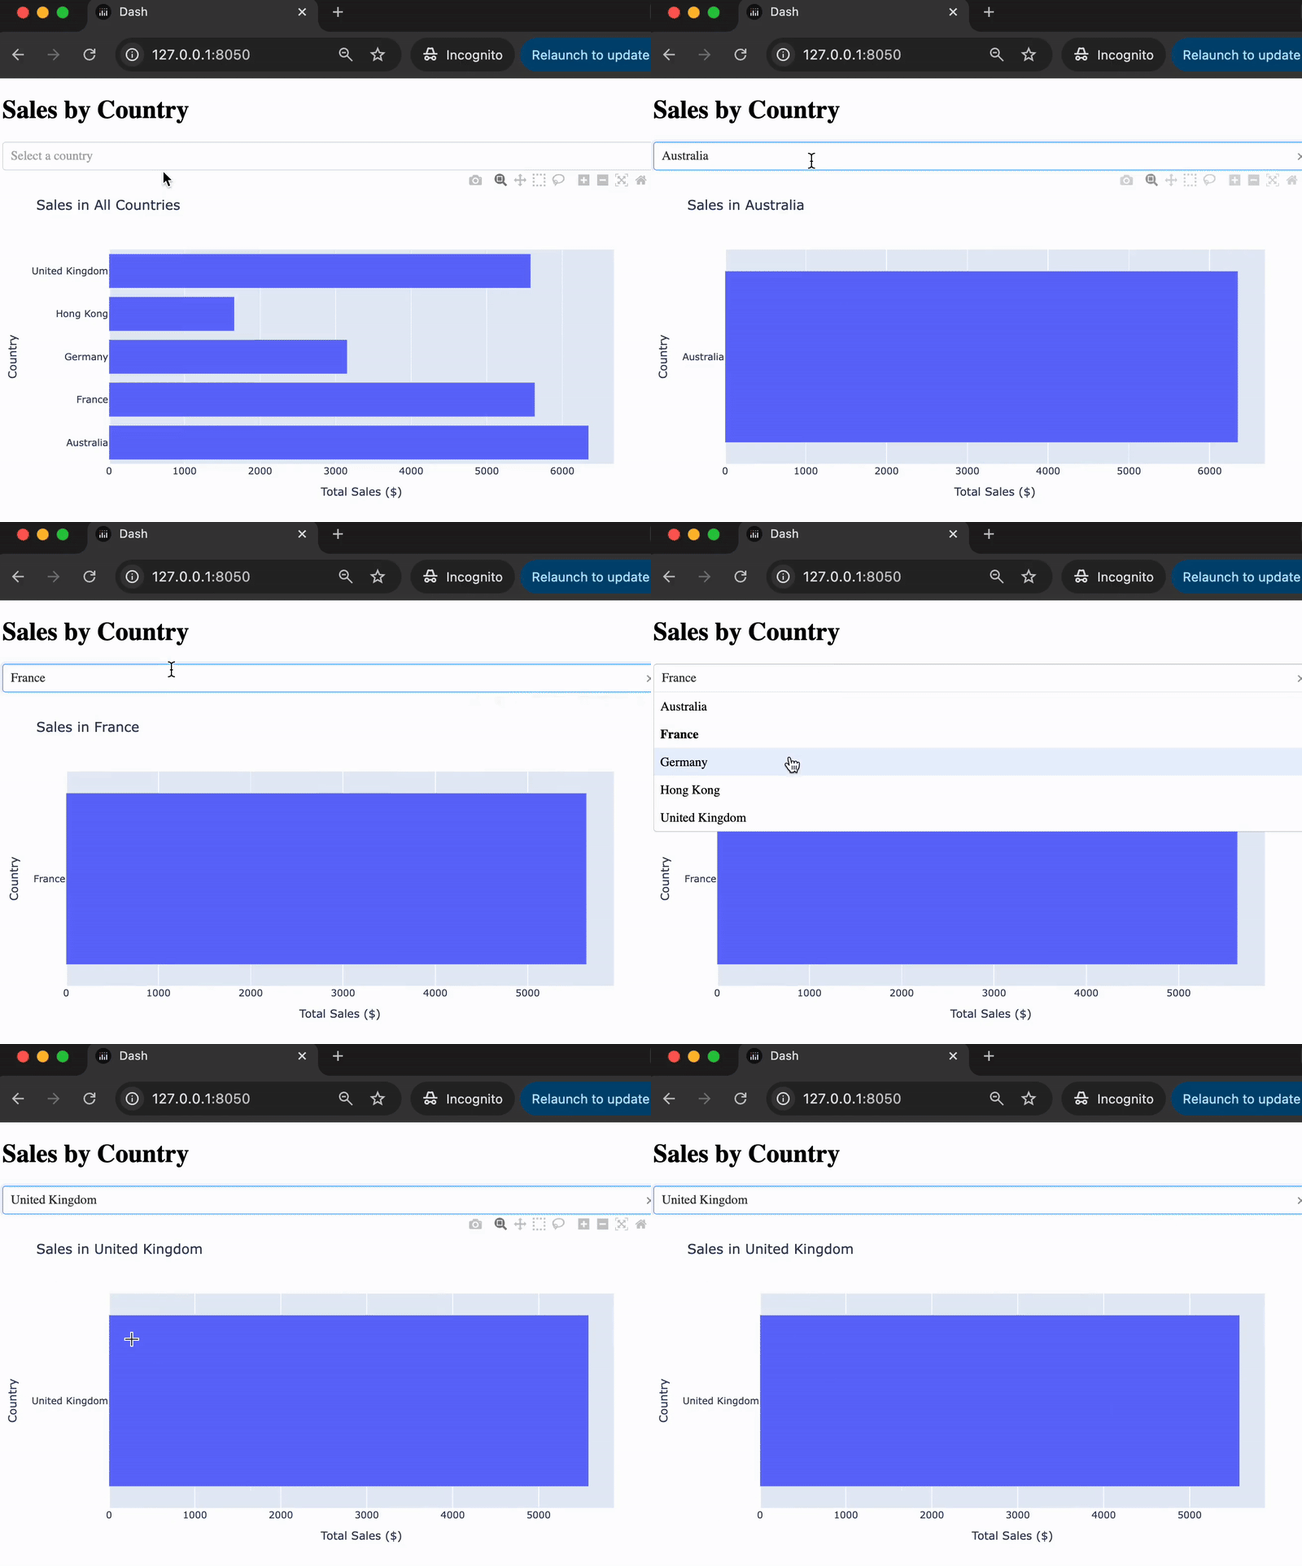
def update_plot(input_country):
    country = 'All Countries'

    sales = ecom_sales.copy(deep=True)

    if input_country:
        country = input_country
        sales = sales[sales['Country'] == country]

        bar_fig = px.bar(
            data_frame=sales, title=f"Sales in {country}",
            x='Total Sales ($)', y='Country')
    return bar_fig
# @callback() def update_plot(input_country): country = 'All Countries'
sales = ecom_sales.copy(deep=True)
if input_country: country = input_country sales = sales[sales['Country'] == country]
bar_fig = px.bar( data_frame=sales, title=f"Sales in {country}", x='Total Sales ($)', y='Country') return bar_fig