Dash में HTML

Dash और Plotly के साथ डैशबोर्ड बनाना

Alex Scriven

Data Scientist

HTML दोबारा


  • HTML = वेब कंटेंट स्ट्रक्चर करने की भाषा
    • 'टैग' जैसे Div, H1>H6 उपयोग करता है
  • Dash dash.html कॉम्पोनेंट्स उपयोग करता है
    • H1 टैग .H1() है
    • Div टैग .Div() है
<div>
  <div style=
       "background-color: red; 
        width:250; height:250;">
  </div>
  <div style=
       "background-color: lightblue; 
        width:250; height:250;">
    <h1>This box</h1>
  </div>
</div>
Dash और Plotly के साथ डैशबोर्ड बनाना

Structuring टैग्स


  • उपलब्ध HTML टैग्स की सूची - documentation
  • महत्वपूर्ण स्ट्रक्चरिंग टैग्स:
    • .Br() = नई लाइन ब्रेक
    • .Img() = इमेज जोड़ें
Dash और Plotly के साथ डैशबोर्ड बनाना

HTML Dash में लिस्ट्स


  • .Ul() \ .Ol() और .Li() = लिस्ट बनाएँ
    • .Ul() अनऑर्डर्ड लिस्ट के लिए (बुलेट-पॉइंट्स, जैसे ये!)
    • .Ol() ऑर्डर्ड लिस्ट के लिए (नंबर-पॉइंट्स)
    • .Li() हर लिस्ट आइटम के लिए
Dash और Plotly के साथ डैशबोर्ड बनाना

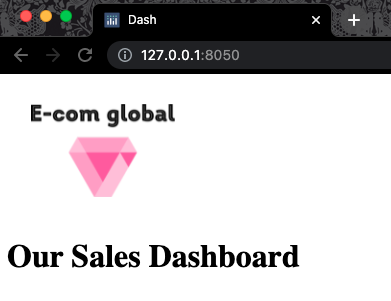
कंपनी लोगो जोड़ना


app.layout = [

html.Img(src='www.website.com/logo.png'), html.H1("Our Sales Dashboard")
]


क्रोम ब्राउज़र के टॉप-लेफ्ट का स्क्रीनशॉट जहाँ URL में सर्वर ऐड्रेस दिख रहा है। ब्राउज़र में कंपनी लोगो की इमेज है, एक गुलाबी डायमंड जिस पर E-com global लिखा है। नीचे 'Our Sales Dashboard' टाइटल दिख रहा है।

Dash और Plotly के साथ डैशबोर्ड बनाना

Text टैग्स


टेक्स्ट कंटेंट सेट और फॉर्मैट करें

  • .P() या .Span() = साधारण टेक्स्ट जोड़ें
    • एक children आर्ग्युमेंट स्वीकारते हैं (टेक्स्ट, .P() या .Span() की लिस्ट)
  • .B() = कुछ टेक्स्ट को Bold करें
  • .I() = कुछ टेक्स्ट को Italic करें
Dash और Plotly के साथ डैशबोर्ड बनाना

Dash में HTML टेक्स्ट टैग्स


कुछ जटिल फॉर्मैटिंग:

app.layout = [
   html.H1("Our Sales Dashboard"),

html.Span(children=[
f"Prepared: {datetime.now().date()}",
" by ", html.B("Jessie Parker, "),
html.I("Data Scientist")
])
]


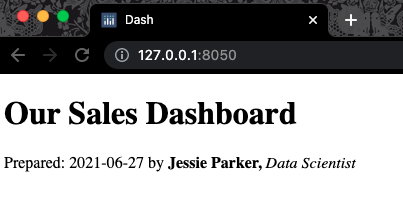
पिछली स्लाइड जैसा ही क्रोम विंडो का टॉप-लेफ्ट स्क्रीनशॉट जहाँ URL बार में सर्वर ऐड्रेस दिख रहा है। बड़ा टाइटल 'our sales dashboard' है। नीचे लाइन है: "Prepared: 2021-06-27 by Jessie Parker, data scientist" जिसमें Jessie Parker बोल्ड है और data scientist इटैलिक में है।

Dash और Plotly के साथ डैशबोर्ड बनाना

टेक्स्ट को तोड़ना

$$

app.layout = [
   html.H1("Our Sales Dashboard"),
   html.Span(children=[
   f"Prepared: {datetime.now().date()}", 
   html.Br(),
   " by ", html.B("Jessie Parker, "),
   html.Br(),
   html.I("Data Scientist")])
    ]

 

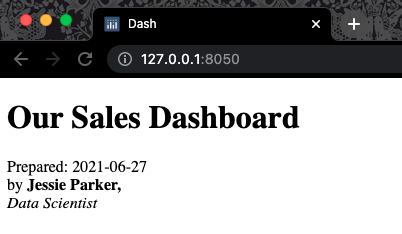
उसी डैशबोर्ड का स्क्रीनशॉट जैसा पिछली स्लाइड में था। क्रोम विंडो के टॉप-लेफ्ट में URL बार में सर्वर ऐड्रेस दिख रहा है। बड़ा टाइटल 'our sales dashboard' है; नीचे लाइन "Prepared: 2021-06-27 by Jessie Parker, data scientist" है। Jessie Parker बोल्ड है, और data scientist इटैलिक में है। अब तारीख और नाम के बाद लाइन ब्रेक हैं।

Dash और Plotly के साथ डैशबोर्ड बनाना

अभ्यास करते हैं!

Dash और Plotly के साथ डैशबोर्ड बनाना

Preparing Video For Download...