Scikit Learn में Random Search
Python में Hyperparameter Tuning

Alex Scriven
Data Scientist
GridSearchCV से तुलना
हमें पहिया फिर से नहीं बनाना. Grid Search के स्टेप्स याद करें:
- कोई algorithm/estimator चुनें
- किन hyperparameters को ट्यून करना है, तय करें
- हर hyperparameter के लिए मानों की रेंज तय करें
- cross-validation स्कीम सेट करें; और
- score फंक्शन तय करें
- ज़रूरी अतिरिक्त जानकारी या फंक्शन शामिल करें
Grid Search से तुलना
सिर्फ एक फर्क है:
- स्टेप 7 = कितने samples लेने हैं, तय करें (फिर sample करें)
बस इतना ही! (अधिकतर)
Scikit Learn मॉड्यूल की तुलना
मॉड्यूल भी मिलते-जुलते हैं:
GridSearchCV:
sklearn.model_selection.GridSearchCV(estimator, param_grid,
        scoring=None, fit_params=None,
        n_jobs=None,
        refit=True, cv='warn', verbose=0,
        pre_dispatch='2*n_jobs',
        error_score='raise-deprecating',
        return_train_score='warn')
RandomizedSearchCV:
sklearn.model_selection.RandomizedSearchCV(estimator,
        param_distributions, n_iter=10,
        scoring=None, fit_params=None,
        n_jobs=None, refit=True,
        cv='warn', verbose=0,
        pre_dispatch='2*n_jobs',
        random_state=None,
        error_score='raise-deprecating',
        return_train_score='warn')
मुख्य अंतर
दो मुख्य फर्क:
n_iterजो random search द्वारा आपकी grid से लिए जाने वाले samples की संख्या है. पिछले उदाहरण में आपने 300 किए थे.param_distributionsparam_gridसे थोड़ा अलग है, जो sampling के लिए distribution सेट करने का वैकल्पिक विकल्प देता है.- डिफ़ॉल्ट रूप से सभी combinations के चुने जाने की बराबर संभावना होती है.
RandomizedSearchCV ऑब्जेक्ट बनाना
अब हम grid search की तरह ही random search ऑब्जेक्ट बना सकते हैं, बस एक छोटा बदलाव करके:
# Set up the sample space learn_rate_list = np.linspace(0.001,2,150) min_samples_leaf_list = list(range(1,51)) # Create the grid parameter_grid = { 'learning_rate' : learn_rate_list, 'min_samples_leaf' : min_samples_leaf_list}# Define how many samples number_models = 10
RandomizedSearchCV ऑब्जेक्ट बनाना
अब हम ऑब्जेक्ट बना सकते हैं
# Create a random search object
random_GBM_class = RandomizedSearchCV(
    estimator = GradientBoostingClassifier(),
    param_distributions = parameter_grid,
    n_iter = number_models,
    scoring='accuracy',
    n_jobs=4,
    cv = 10,
    refit=True,
    return_train_score = True)
# Fit the object to our data
random_GBM_class.fit(X_train, y_train)
आउटपुट का विश्लेषण
आउटपुट बिल्कुल वही है!
कौन से hyperparameter मान चुने गए, यह कैसे देखें?
cv_results_ डिक्शनरी (संबंधित param_ कॉलम्स में)!
लिस्ट निकालें:
rand_x = list(random_GBM_class.cv_results_['param_learning_rate'])
rand_y = list(random_GBM_class.cv_results_['param_min_samples_leaf'])
आउटपुट का विश्लेषण
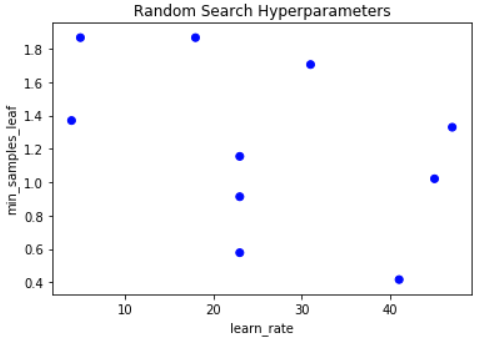
अपनी visualization बनाएं:
# Make sure we set the limits of Y and X appriately x_lims = [np.min(learn_rate_list), np.max(learn_rate_list)] y_lims = [np.min(min_samples_leaf_list), np.max(min_samples_leaf_list)]# Plot grid results plt.scatter(rand_y, rand_x, c=['blue']*10) plt.gca().set(xlabel='learn_rate', ylabel='min_samples_leaf', title='Random Search Hyperparameters') plt.show()
आउटपुट का विश्लेषण
पहले जैसा ही एक ग्राफ:
अभ्यास करते हैं!
Python में Hyperparameter Tuning

