दो से अधिक explanatory वैरिएबल

इंटरमीडिएट Regression with statsmodels in Python

Maarten Van den Broeck

Content Developer at DataCamp

पिछली बार से
sns.scatterplot(x="length_cm", 
                y="height_cm",
                data=fish,
                hue="mass_g")

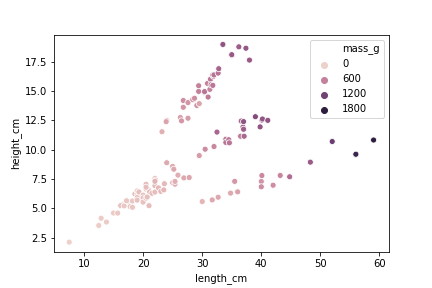
2D स्कैटर प्लॉट, तीसरी संख्यात्मक वैरिएबल दिखाने के लिए mass को रंग से दर्शाया गया है.

इंटरमीडिएट Regression with statsmodels in Python

Species के अनुसार faceting

grid = sns.FacetGrid(data=fish,

col="species",
hue="mass_g", col_wrap=2,
palette="plasma")
grid.map(sns.scatterplot,
         "length_cm",
         "height_cm")
plt.show()

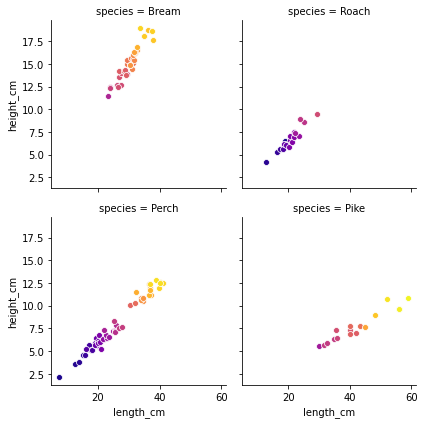
मछली के height, length और mass का स्कैटर प्लॉट, species के अनुसार faceting. ज्यादा चमकीला रंग = भारी मछली.

इंटरमीडिएट Regression with statsmodels in Python

Species के अनुसार faceting

  • Faceting के लिए एक से अधिक categorical वैरिएबल संभव हैं
  • Faceting का अति-उपयोग न करें
  • वैरिएबल बढ़ने पर plotting कठिन हो जाती है

मछली के height, length और mass का स्कैटर प्लॉट, species के अनुसार faceting. ज्यादा चमकीला रंग = भारी मछली.

इंटरमीडिएट Regression with statsmodels in Python

Interaction के अलग स्तर

कोई interaction नहीं

ols("mass_g ~ length_cm + height_cm + species + 0", data=fish).fit()

वैरिएबल के जोड़ों के बीच two-way interactions

ols(
  "mass_g ~ length_cm + height_cm + species +
  length_cm:height_cm + length_cm:species + height_cm:species + 0", data=fish).fit()

तीनों वैरिएबल के बीच three-way interaction

ols(
  "mass_g ~ length_cm + height_cm + species + 
  length_cm:height_cm + length_cm:species + height_cm:species + length_cm:height_cm:species + 0", data=fish).fit()
इंटरमीडिएट Regression with statsmodels in Python

सभी interactions

ols(
  "mass_g ~ length_cm + height_cm + species + 
  length_cm:height_cm + length_cm:species + height_cm:species + length_cm:height_cm:species + 0", 
  data=fish).fit()

उसी के समान

ols(
  "mass_g ~ length_cm * height_cm * species + 0", 
  data=fish).fit()
इंटरमीडिएट Regression with statsmodels in Python

सिर्फ two-way interactions

ols(
  "mass_g ~ length_cm + height_cm + species + 
  length_cm:height_cm + length_cm:species + height_cm:species + 0", 
  data=fish).fit()

उसी के समान

ols(
  "mass_g ~ (length_cm + height_cm + species) ** 2 + 0", 
  data=fish).fit()
इंटरमीडिएट Regression with statsmodels in Python

Prediction फ्लो

mdl_mass_vs_all = ols(
  "mass_g ~ length_cm * height_cm * species + 0",
  data=fish).fit()

length_cm = np.arange(5, 61, 5)
height_cm = np.arange(2, 21, 2)
species = fish["species"].unique()

p = product(length_cm, height_cm, species)

explanatory_data = pd.DataFrame(p,
                                columns=["length_cm",
                                         "height_cm",
                                         "species"])

prediction_data = explanatory_data.assign(
  mass_g = mdl_mass_vs_all.predict(explanatory_data))

print(prediction_data)
     length_cm  height_cm species       mass_g
0            5          2   Bream  -570.656437
1            5          2   Roach    31.449145
2            5          2   Perch    43.789984
3            5          2    Pike   271.270093
4            5          4   Bream  -451.127405
..         ...        ...     ...          ...
475         60         18    Pike  2690.346384
476         60         20   Bream  1531.618475
477         60         20   Roach  2621.797668
478         60         20   Perch  3041.931709
479         60         20    Pike  2926.352397

[480 rows x 4 columns]
इंटरमीडिएट Regression with statsmodels in Python

अभ्यास करते हैं!

इंटरमीडिएट Regression with statsmodels in Python

Preparing Video For Download...