Python में बायोमेडिकल इमेज विश्लेषण
Stephen Bailey
Instructor
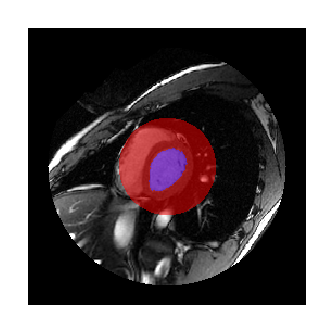
कार्डियक टाइम सीरीज़ के एक वॉल्यूम के लिए हमारे पास ये लेबल हैं:

scipy.ndimage.measurements
ndi.mean()
ndi.median()
ndi.sum()
ndi.maximum()
ndi.standard_deviation()
ndi.variance()
सभी डाइमेंशनों पर लगाई जाने वाली फंक्शन, चाहें तो खास लेबल्स पर।
कस्टम फंक्शन:
ndi.labeled_comprehension()
import imageio.v2 as imageio import scipy.ndimage as ndi vol=imageio.volread('SCD-3d.npz') label=imageio.volread('labels.npz')# All pixels ndi.mean(vol)
3.7892
# Labeled pixels
ndi.mean(vol, label)
89.2342
# Label 1
ndi.mean(vol, label, index=1)
163.2930
# Labels 1 and 2
ndi.mean(vol, label, index=[1,2])
[163.2930, 60.2847]
hist=ndi.histogram(vol, min=0, max=255, bins=256)obj_hists=ndi.histogram(vol, 0, 255, 256, labels, index=[1, 2]) len(obj_hists)
2
plt.plot(obj_hists[0],
label='Left ventricle')
plt.plot(obj_hists[1],
label='Other labelled pixels')
plt.legend()
plt.show()
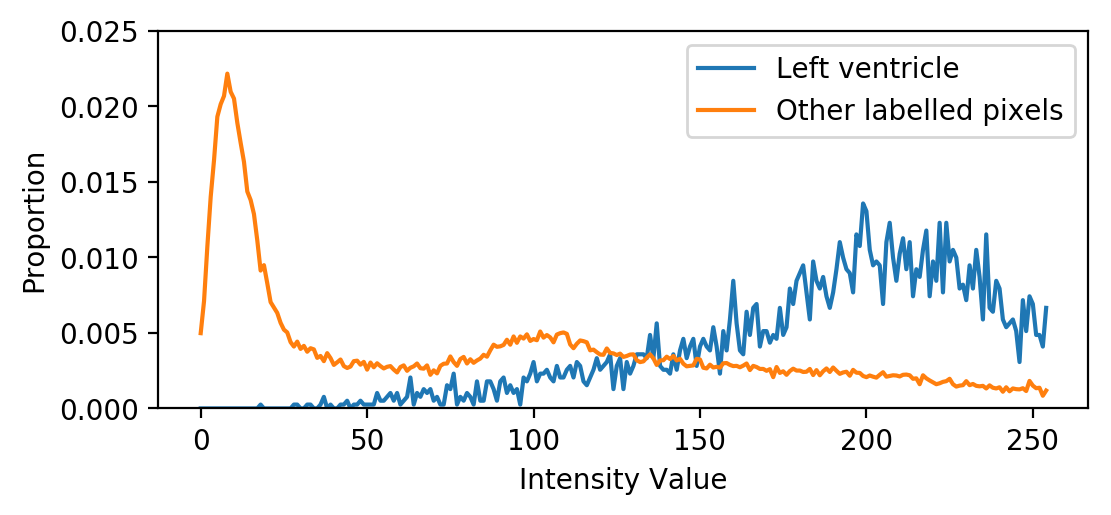
कई टिश्यू टाइप वाले हिस्टोग्राम में कई पीक होंगे
अच्छी तरह से सेगमेंटेड टिश्यू के हिस्टोग्राम अक्सर नॉर्मल डिस्ट्रीब्यूशन जैसे दिखते हैं
Python में बायोमेडिकल इमेज विश्लेषण