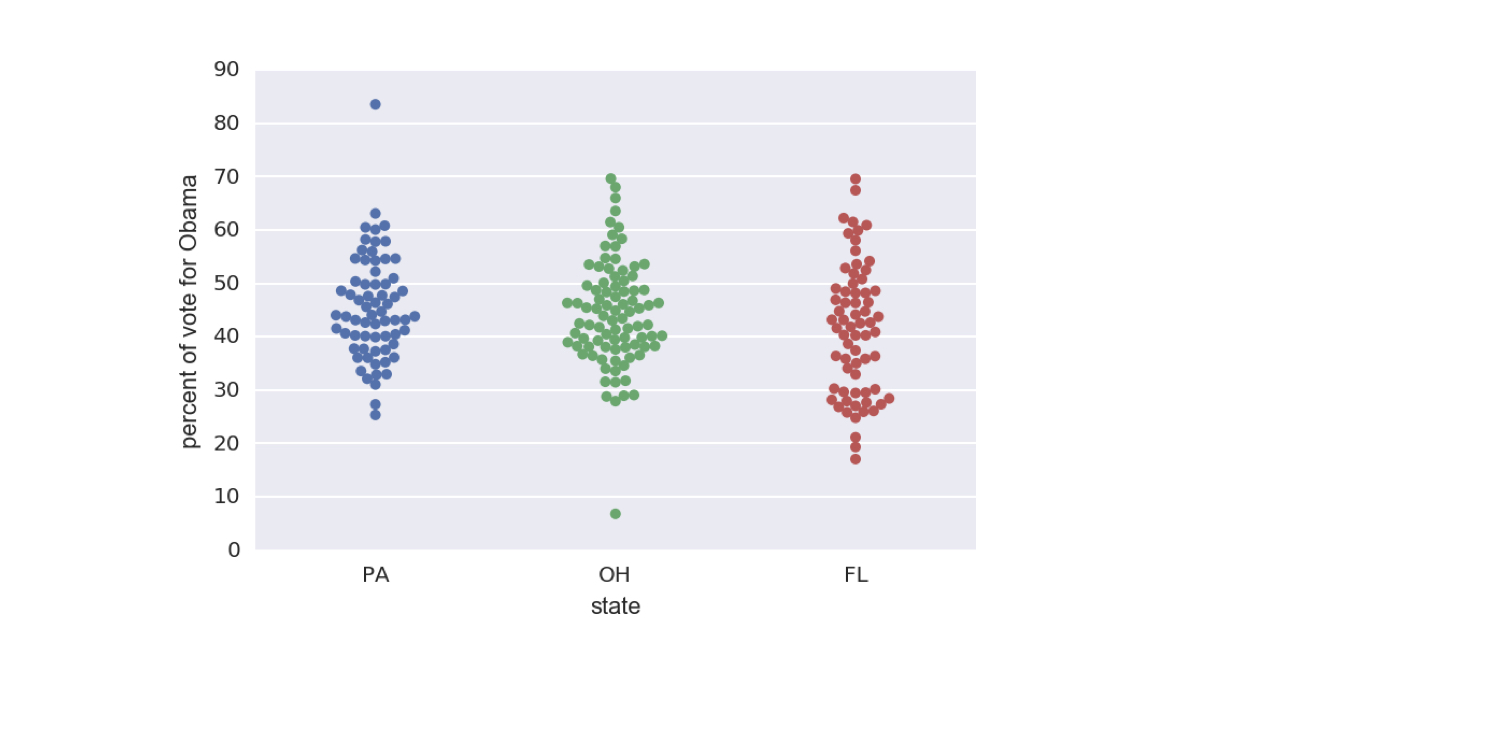
सारा डेटा दिखाएँ: Bee swarm plots

Statistical Thinking in Python (Part 1)

Justin Bois

Teaching Professor at the California Institute of Technology

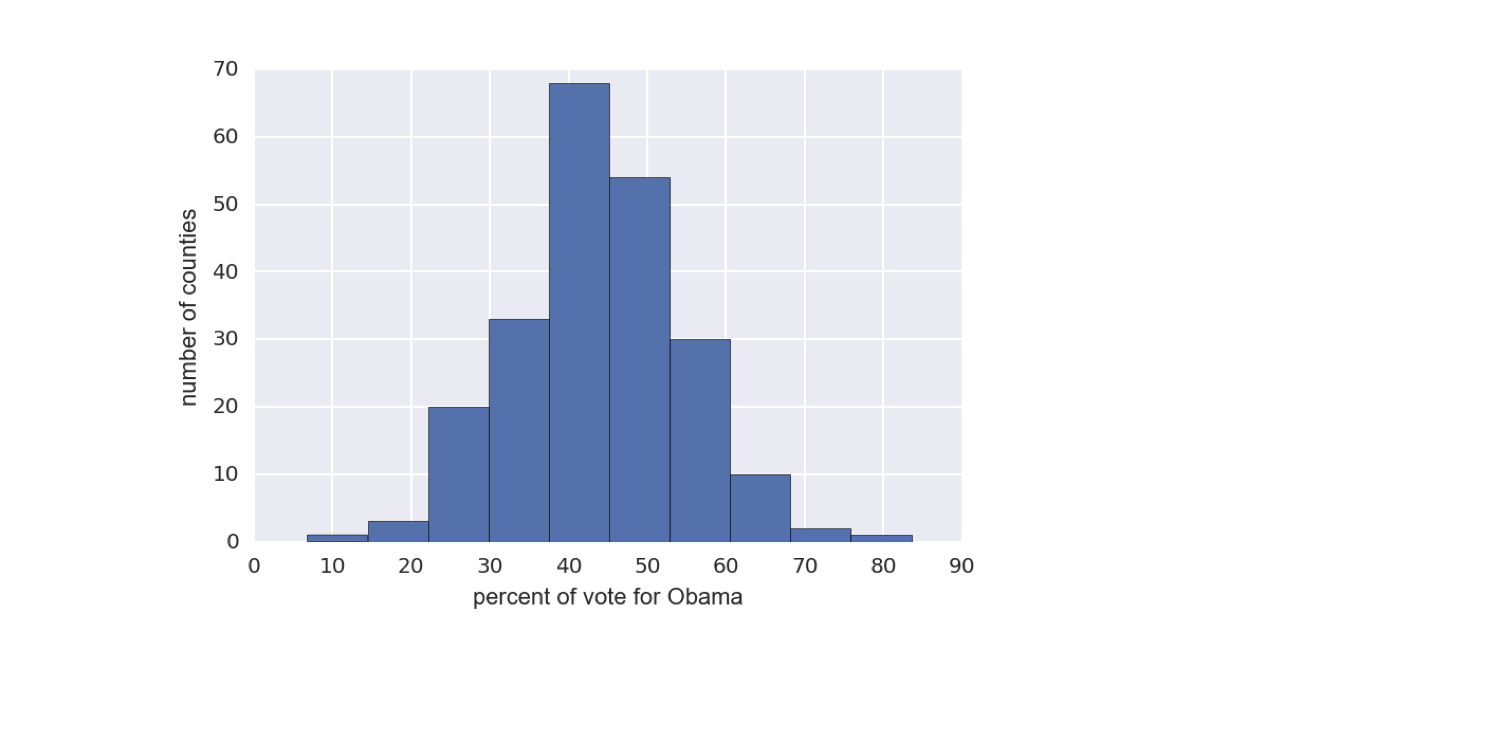
2008 US स्विंग स्टेट चुनाव परिणाम
ch1-3.003.png

1 Data retrieved from Data.gov (https://www.data.gov/)
Statistical Thinking in Python (Part 1)

2008 US स्विंग स्टेट चुनाव परिणाम

ch1-3.005.png

1 Data retrieved from Data.gov (https://www.data.gov/)
Statistical Thinking in Python (Part 1)

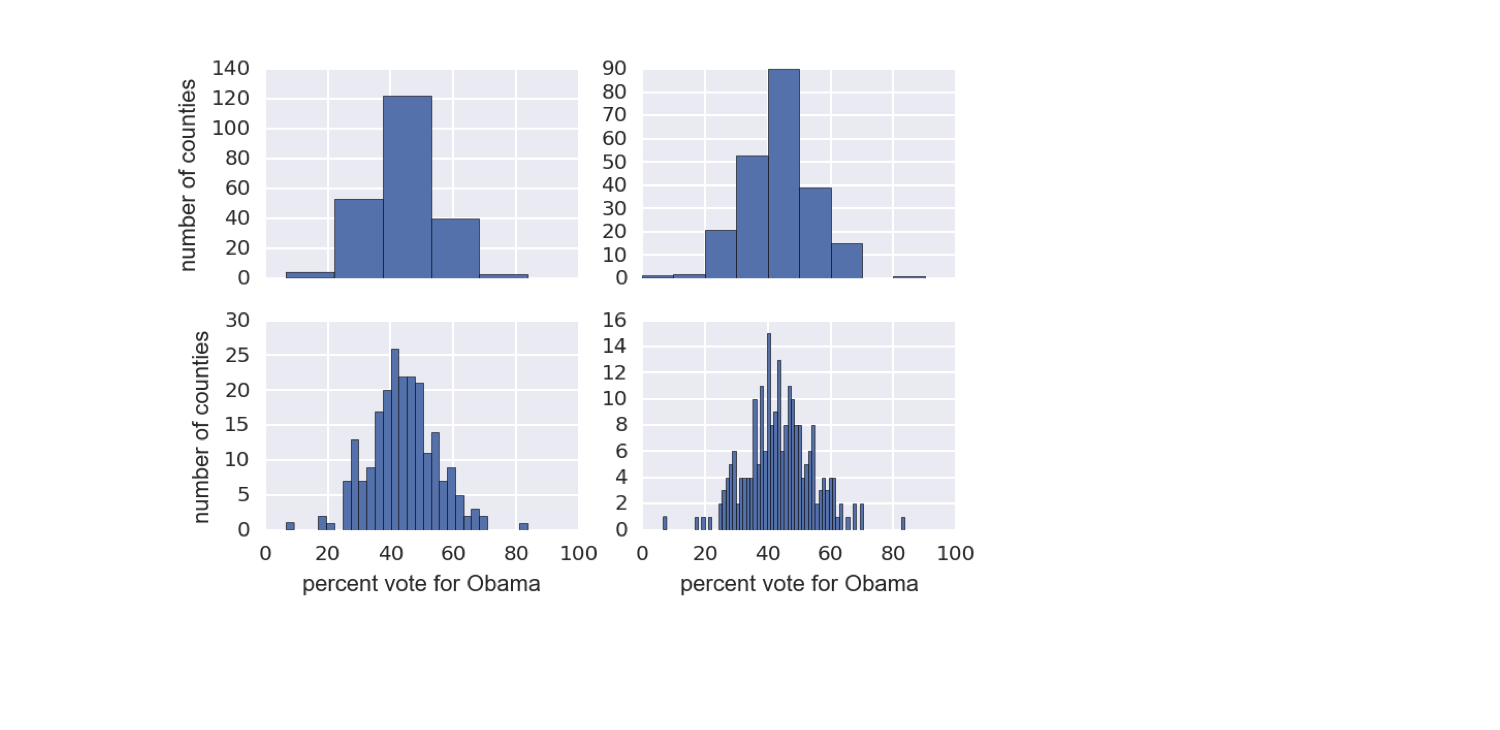
Binning bias

  • एक ही डेटा का अर्थ बिन्स की पसंद पर बदल सकता है
Statistical Thinking in Python (Part 1)

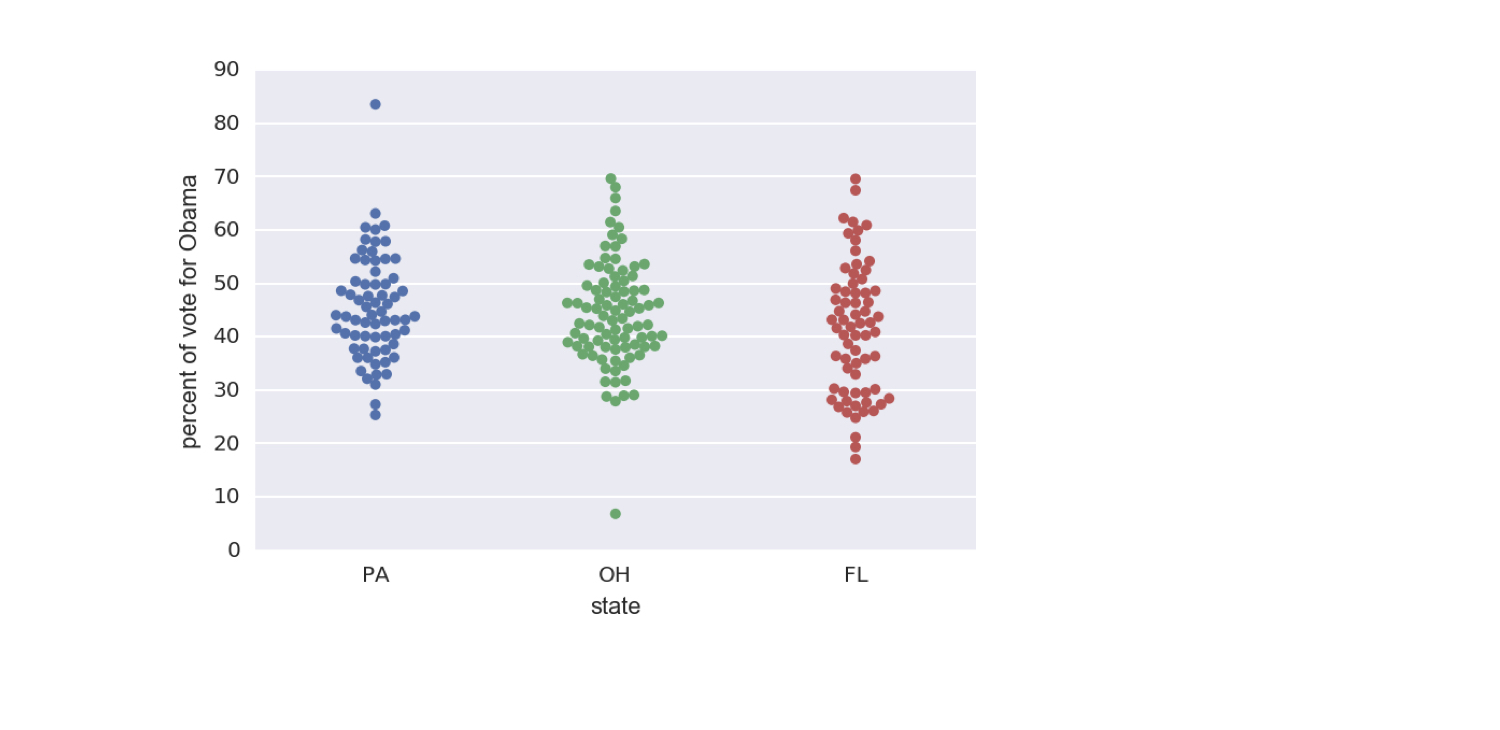
Bee swarm plot

ch1-3.009.png

1 Data retrieved from Data.gov (https://www.data.gov/)
Statistical Thinking in Python (Part 1)

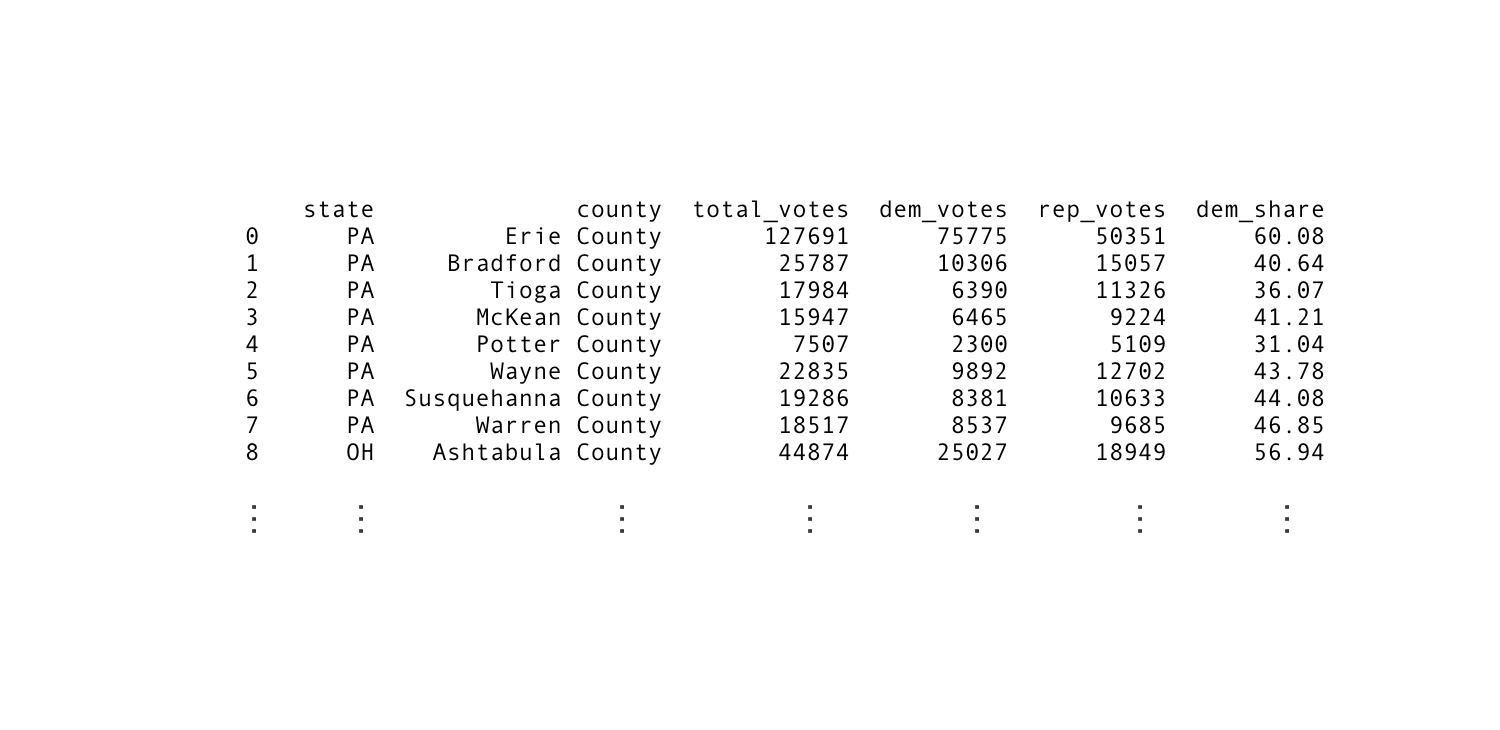
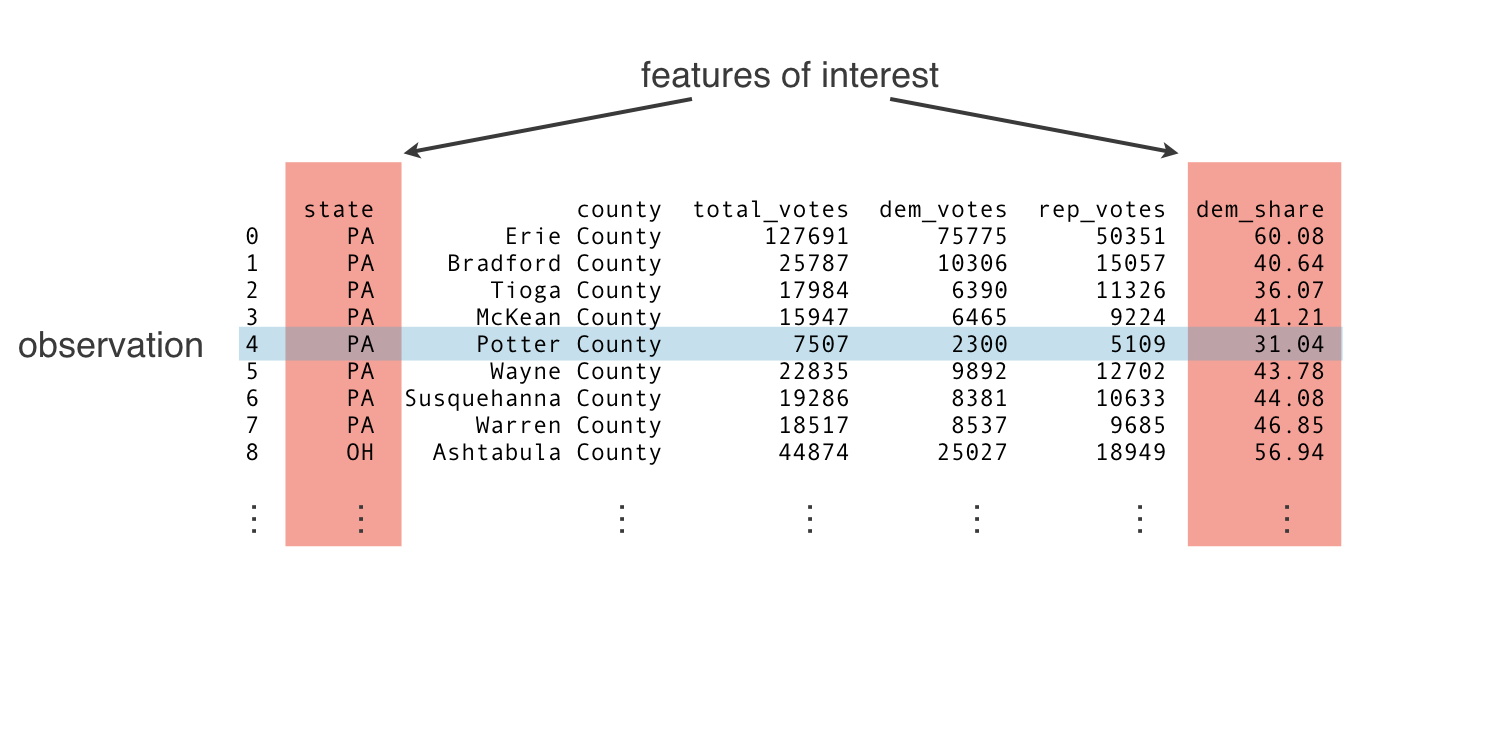
डेटा फ़्रेम का संगठन

ch1-3_v2.011.png

1 Data retrieved from Data.gov (https://www.data.gov/)
Statistical Thinking in Python (Part 1)

डेटा फ़्रेम का संगठन

ch1-3_v2.012.png

Statistical Thinking in Python (Part 1)

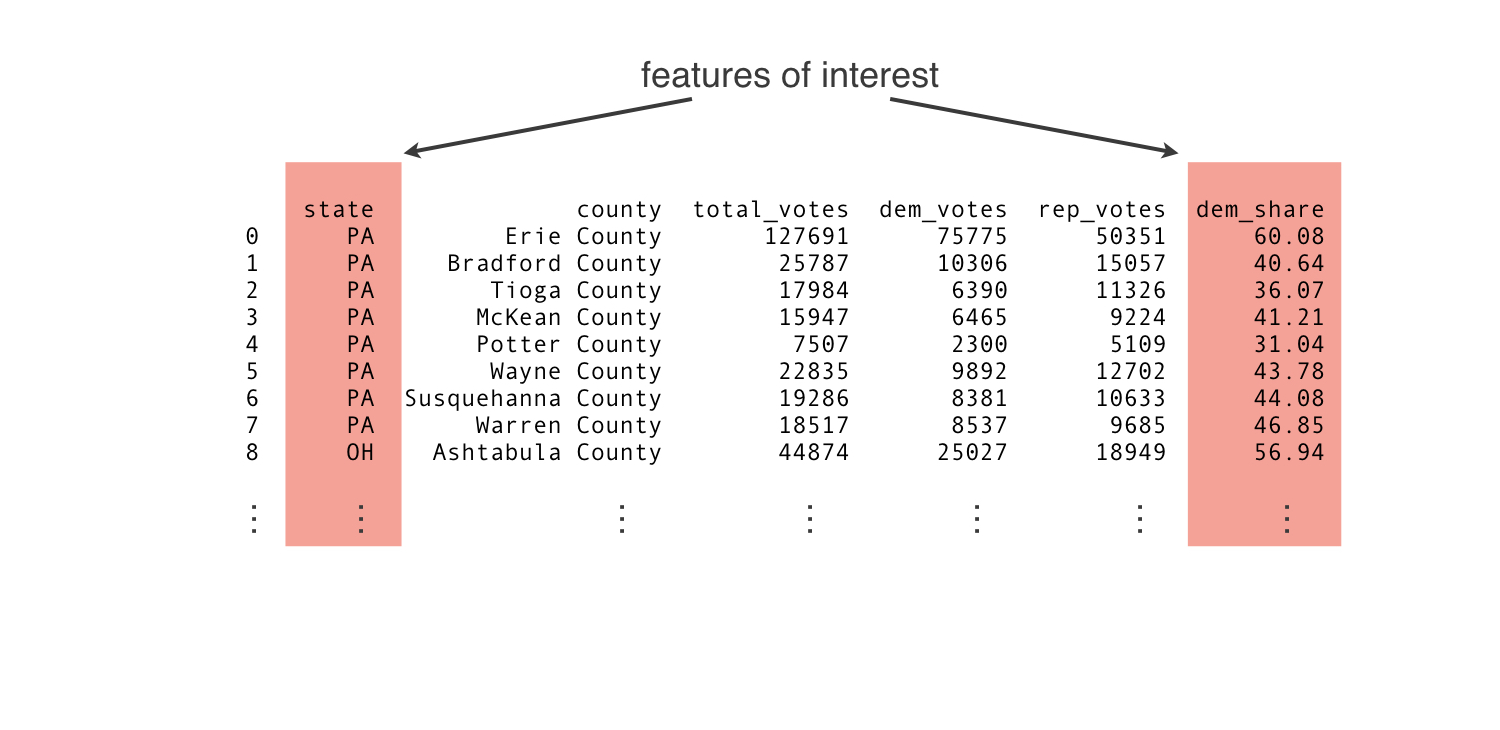
डेटा फ़्रेम का संगठन

ch1-3_v2.013.png

Statistical Thinking in Python (Part 1)

Bee swarm plot बनाना

_ = sns.swarmplot(x='state', y='dem_share', data=df_swing)
_ = plt.xlabel('state')
_ = plt.ylabel('percent of vote for Obama')
plt.show()
Statistical Thinking in Python (Part 1)

2008 US स्विंग स्टेट चुनाव परिणाम

ch1-3_v2.018.png

1 Data retrieved from Data.gov (https://www.data.gov/)
Statistical Thinking in Python (Part 1)

अभ्यास करते हैं!

Statistical Thinking in Python (Part 1)

Preparing Video For Download...