Covariance और Pearson correlation coefficient

Statistical Thinking in Python (Part 1)

Justin Bois

Teaching Professor at the California Institute of Technology

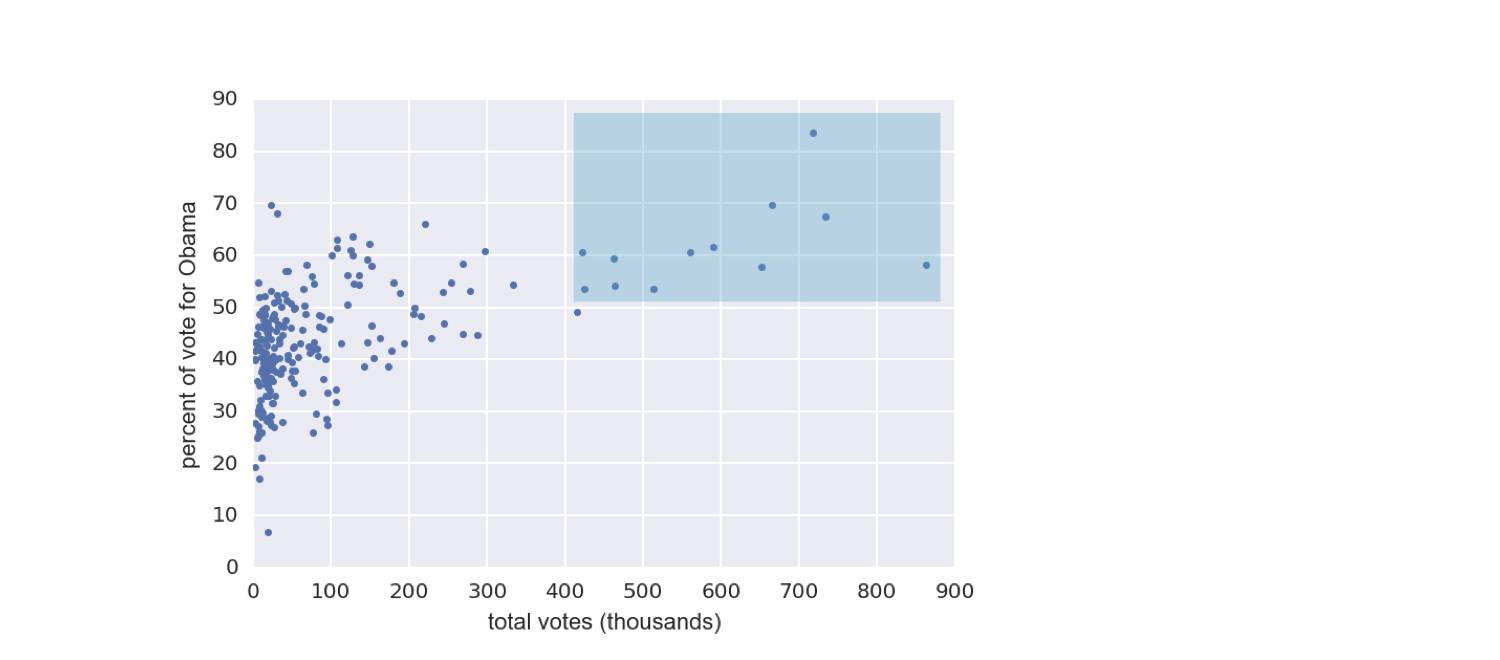
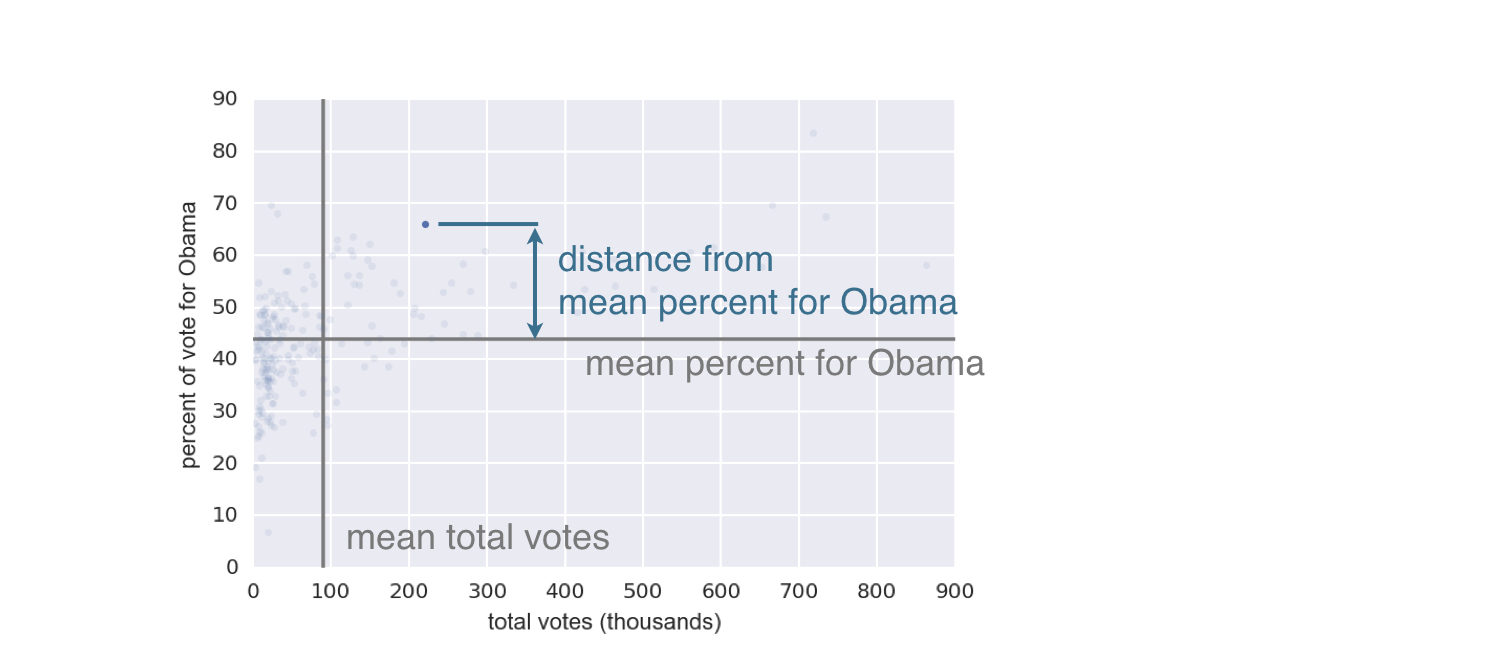
2008 US स्विंग स्टेट चुनाव परिणाम
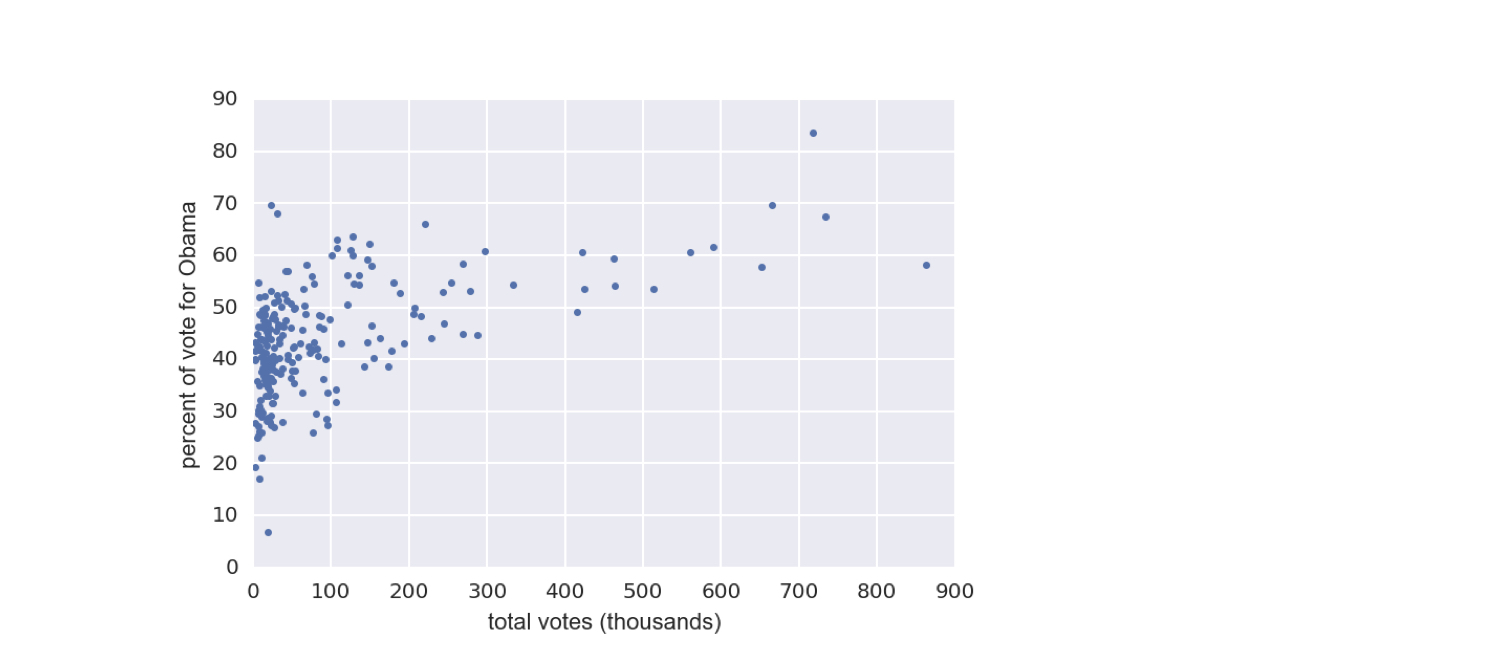
ch2-4_v2.003.png

1 Data retrieved from Data.gov (https://www.data.gov/)
Statistical Thinking in Python (Part 1)

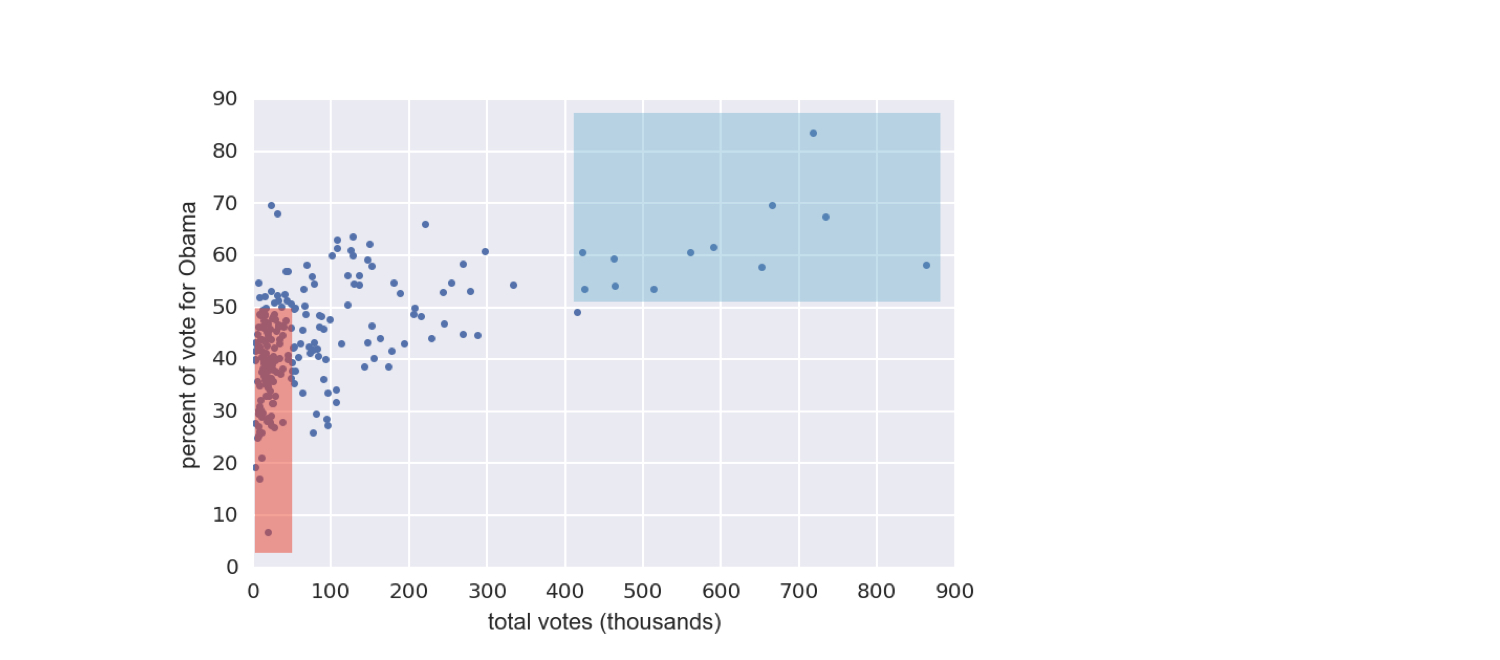
2008 US स्विंग स्टेट चुनाव परिणाम

ch2-4_v2.004.png

1 Data retrieved from Data.gov (https://www.data.gov/)
Statistical Thinking in Python (Part 1)

2008 US स्विंग स्टेट चुनाव परिणाम

ch2-4_v2.005.png

1 Data retrieved from Data.gov (https://www.data.gov/)
Statistical Thinking in Python (Part 1)

स्कैटर प्लॉट बनाना

_ = plt.plot(total_votes/1000, dem_share,
             marker='.', linestyle='none')
_ = plt.xlabel('total votes (thousands)')
_ = plt.ylabel('percent of vote for Obama')
Statistical Thinking in Python (Part 1)

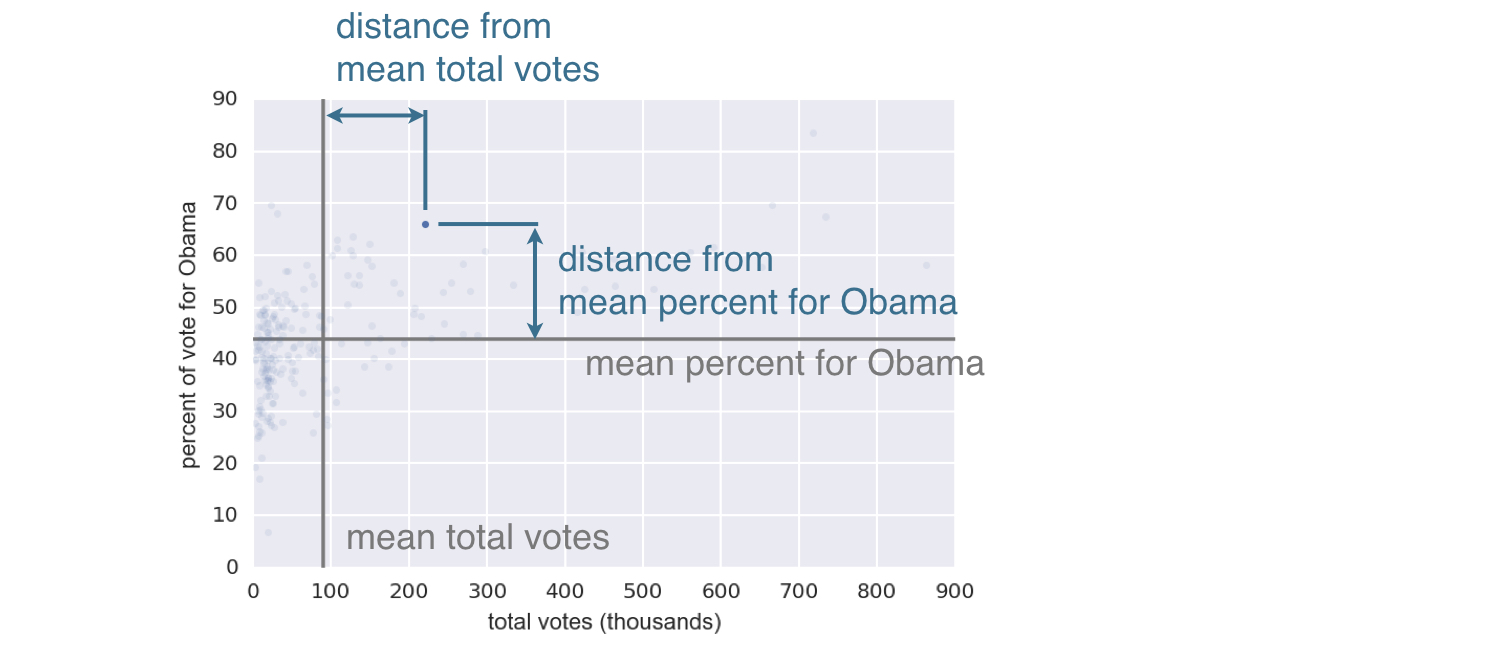
Covariance

  • यह मापता है कि दो राशियाँ साथ में कैसे बदलती हैं
Statistical Thinking in Python (Part 1)

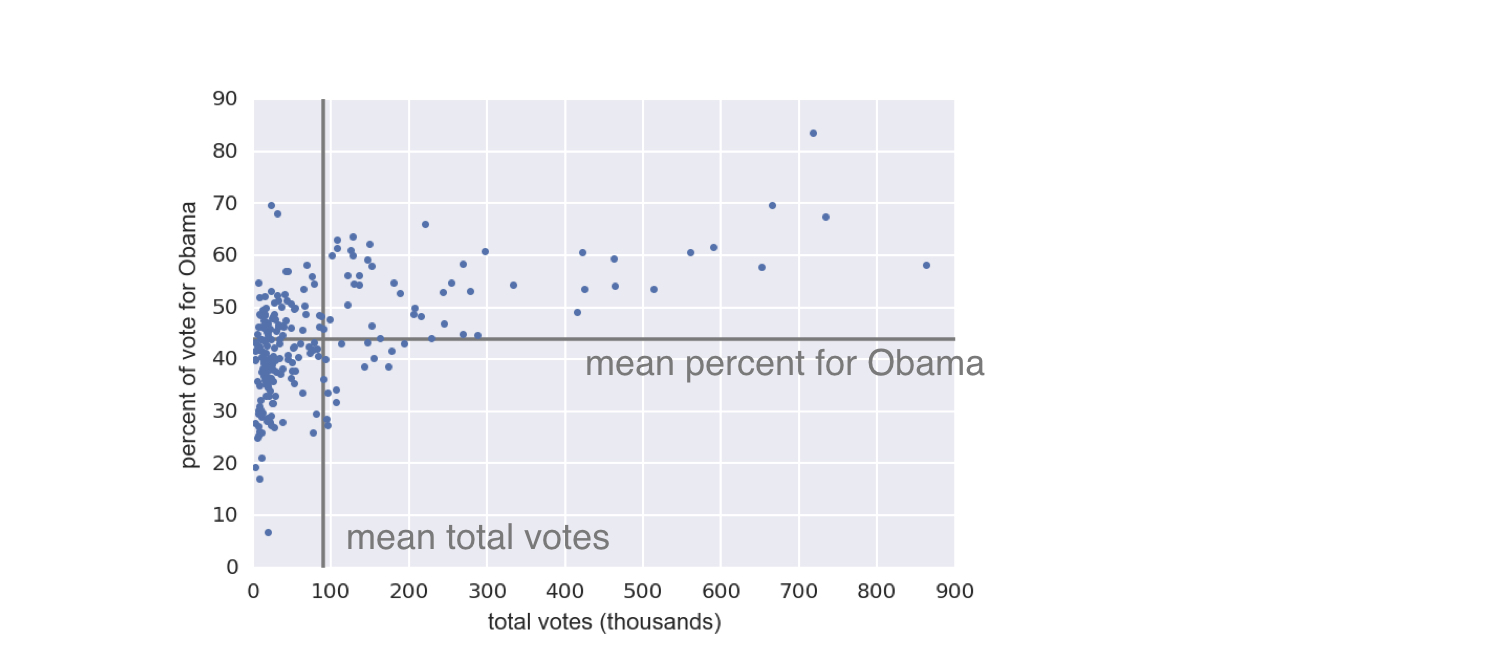
Covariance की गणना

ch2-4_v2.011.png

1 Data retrieved from Data.gov (https://www.data.gov/)
Statistical Thinking in Python (Part 1)

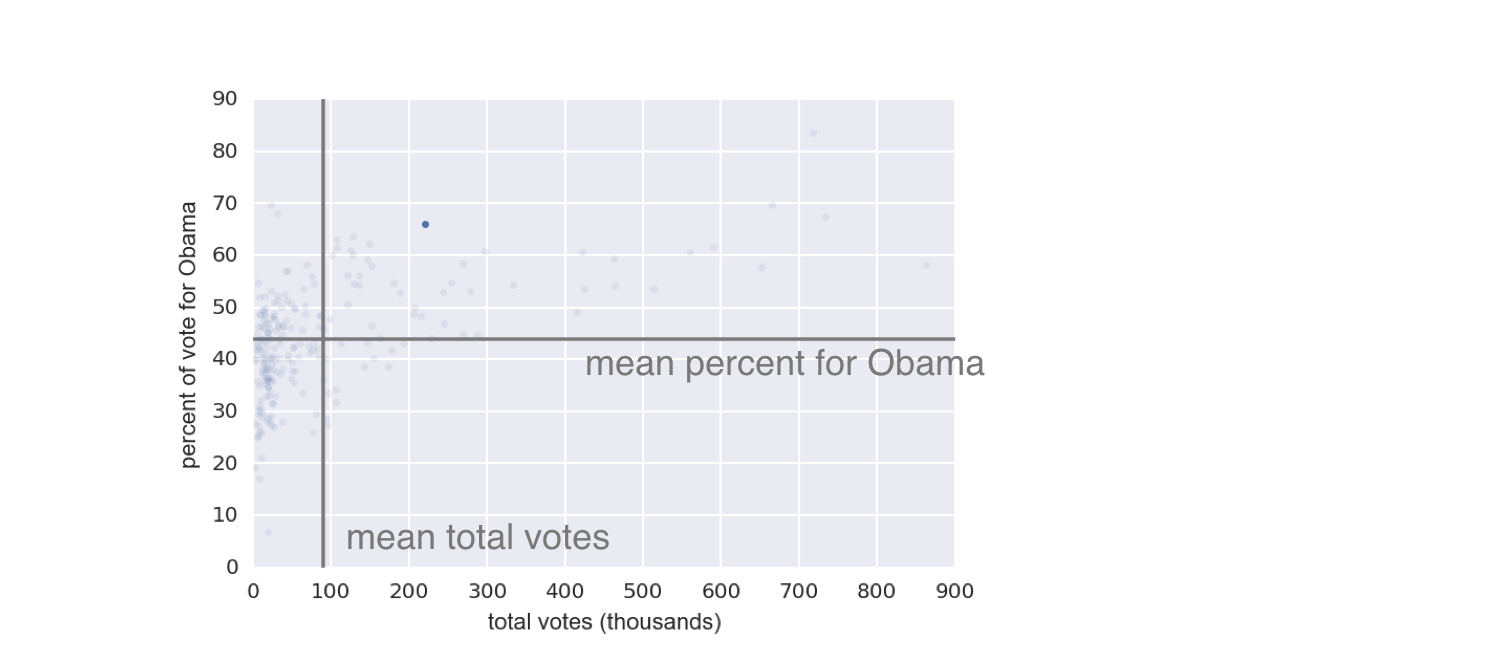
Covariance की गणना

ch2-4_v2.012.png

1 Data retrieved from Data.gov (https://www.data.gov/)
Statistical Thinking in Python (Part 1)

Covariance की गणना

ch2-4_v2.013.png

1 Data retrieved from Data.gov (https://www.data.gov/)
Statistical Thinking in Python (Part 1)

Covariance की गणना

ch2-4_v2.014.png

$$covariance = \frac{1}{n}\sum_{i=1}^{n}(x_i - \bar{x})(y_i - \bar{y})$$

1 Data retrieved from Data.gov (https://www.data.gov/)
Statistical Thinking in Python (Part 1)

Pearson correlation coefficient

$$\rho = \text{Pearson correlation} = \frac{\text{covariance}}{(\text{std of x}) (\text{std of y})}$$

$$= \frac{\text{को-डिपेन्डेन्स से होने वाली variability}}{\text{independant variability}}$$

Statistical Thinking in Python (Part 1)

Pearson correlation coefficient के उदाहरण
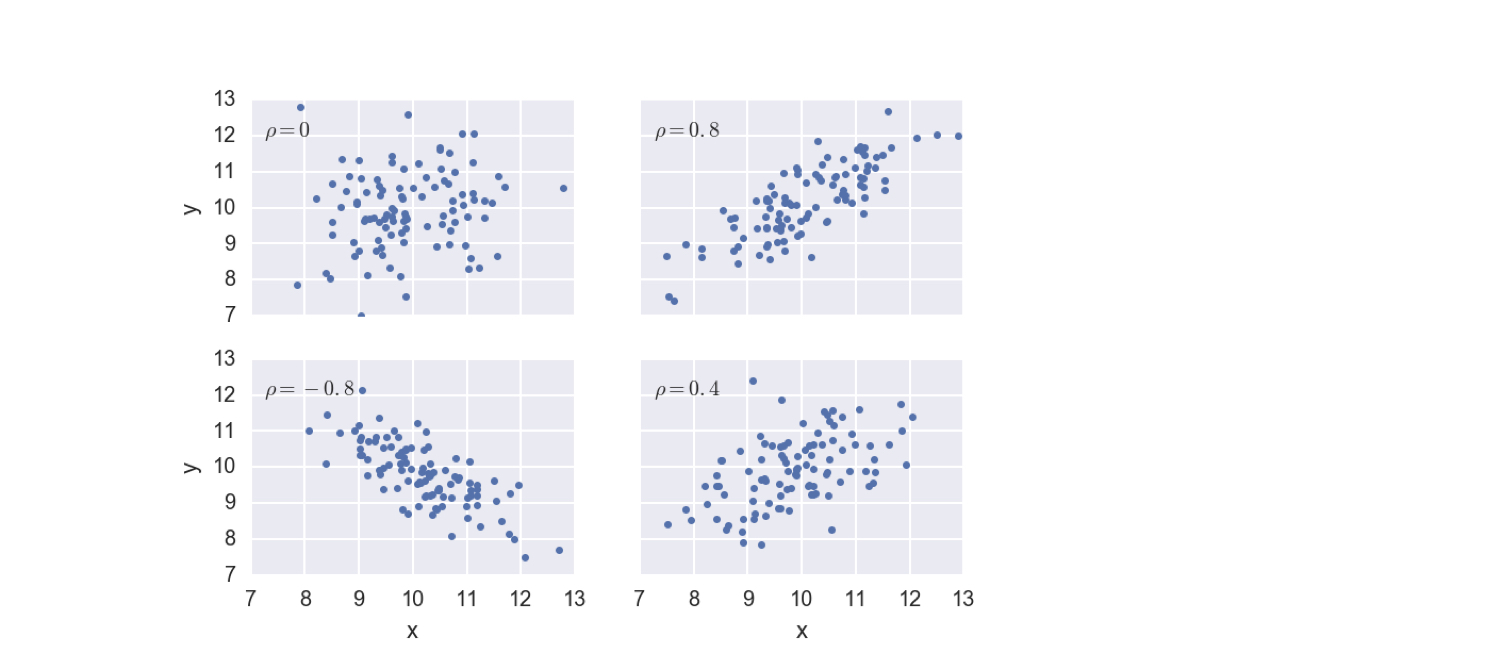
ch2-4_v2.020.png

Statistical Thinking in Python (Part 1)

अभ्यास करते हैं!

Statistical Thinking in Python (Part 1)

Preparing Video For Download...