Exploratory Data Analysis परिचय

Statistical Thinking in Python (Part 1)

Justin Bois

Teaching Professor at the California Institute of Technology

Exploratory data analysis

  • किसी डेटासेट को व्यवस्थित करने, प्लॉट करने, और संक्षेपित करने की प्रक्रिया
Statistical Thinking in Python (Part 1)


"Exploratory data analysis पूरी कहानी नहीं बन सकता, लेकिन नींव की ईंट के सिवा और कुछ नहीं हो सकता।" —John Tukey

Statistical Thinking in Python (Part 1)

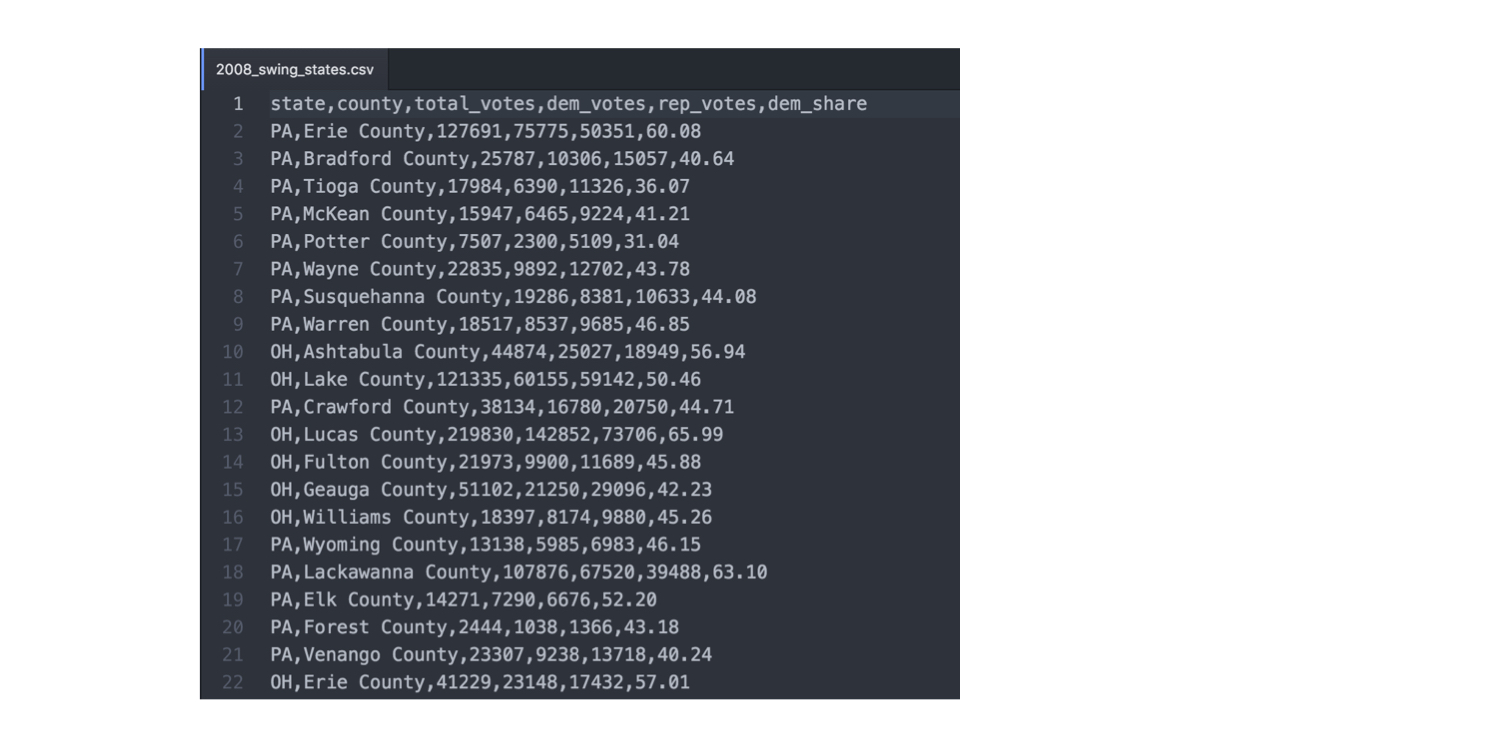
2008 US स्विंग स्टेट चुनाव परिणाम

ch1-1.006.png

1 Data.gov से प्राप्त डेटा (https://www.data.gov/)
Statistical Thinking in Python (Part 1)

2008 US स्विंग स्टेट चुनाव परिणाम

import pandas as pd
df_swing = pd.read_csv('2008_swing_states.csv')
df_swing[['state', 'county', 'dem_share']]
    state              county  dem_share
0      PA         Erie County      60.08
1      PA     Bradford County      40.64
2      PA        Tioga County      36.07
3      PA       McKean County      41.21
4      PA       Potter County      31.04
5      PA        Wayne County      43.78
6      PA  Susquehanna County      44.08
7      PA       Warren County      46.85
8      OH    Ashtabula County      56.94
1 Data.gov से प्राप्त डेटा (https://www.data.gov/)
Statistical Thinking in Python (Part 1)

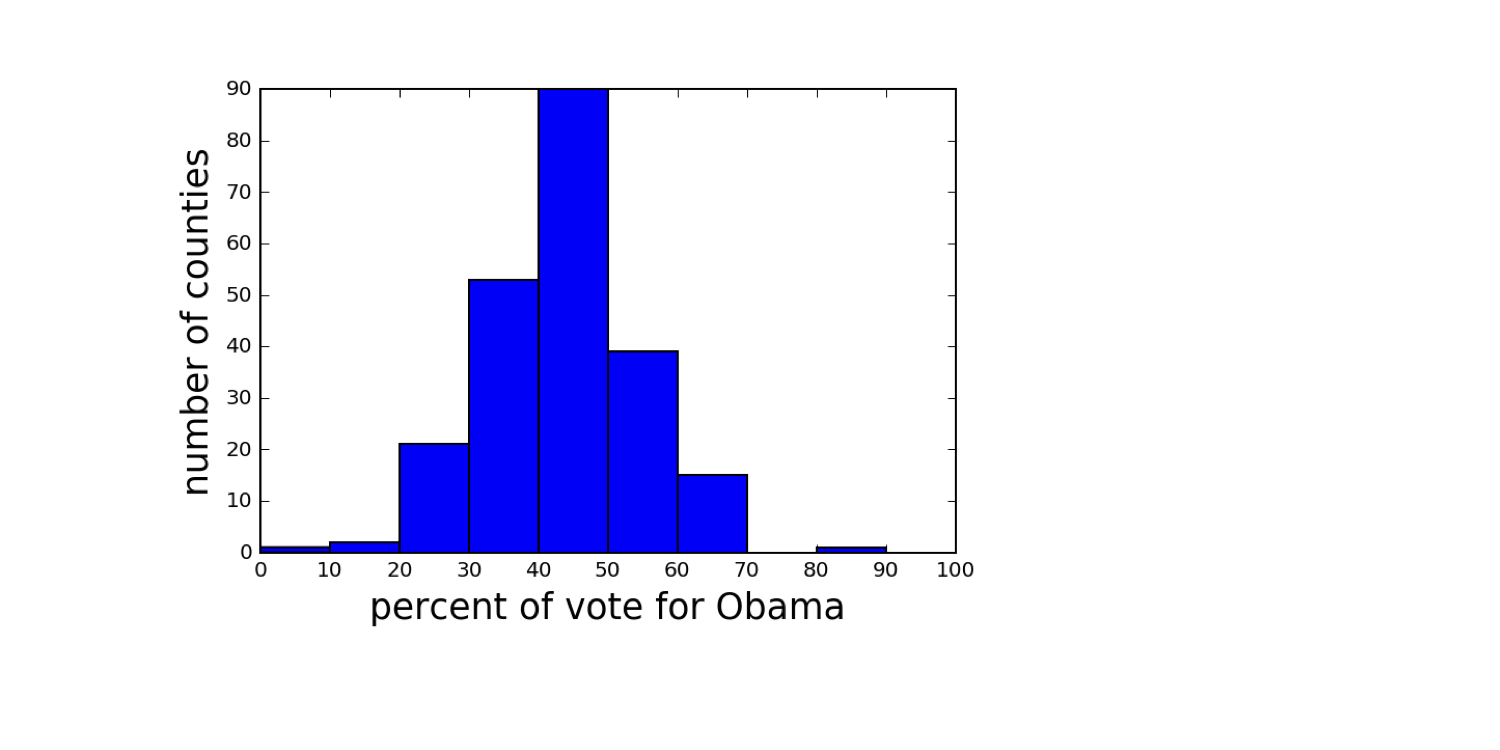
2008 US स्विंग स्टेट चुनाव परिणाम

ch1-1.009.png

1 Data.gov से प्राप्त डेटा (https://www.data.gov/)
Statistical Thinking in Python (Part 1)

अभ्यास करते हैं!

Statistical Thinking in Python (Part 1)

Preparing Video For Download...