सिमुलेशन-आधारित इनफेरेंस

R में Linear Regression के लिए Inference

Jo Hardin

Professor, Pomona College
R में Linear Regression के लिए Inference

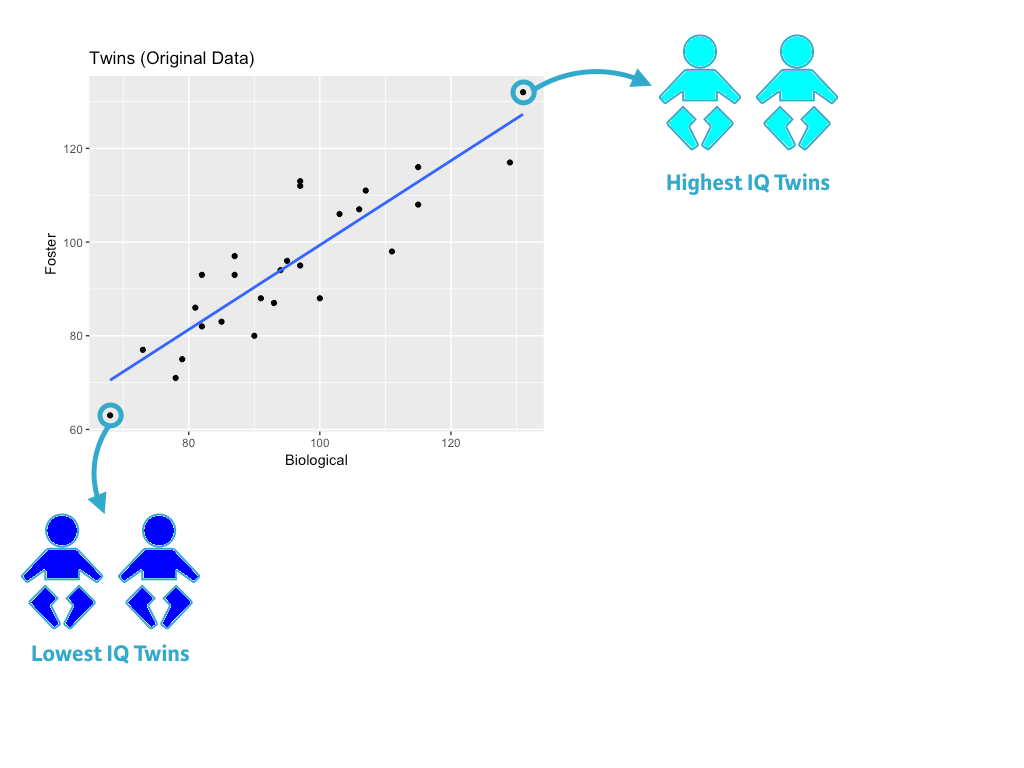
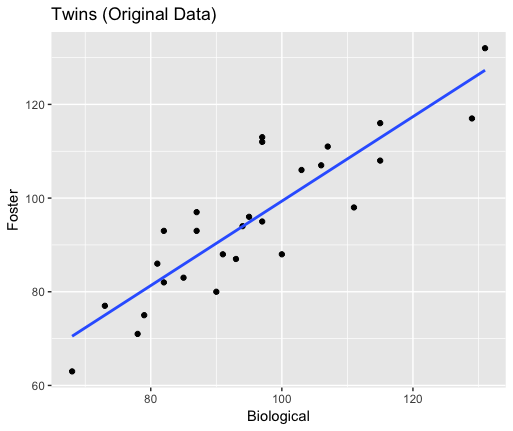
जुड़वाँ के IQs का स्कैटर प्लॉट।

R में Linear Regression के लिए Inference

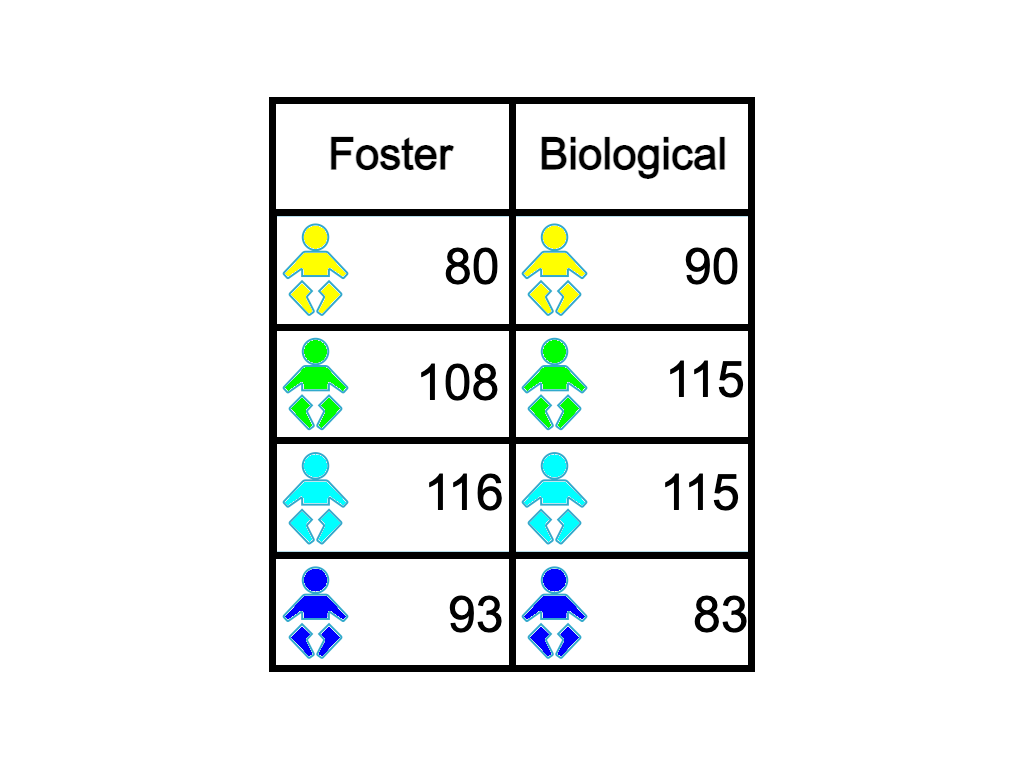
जुड़वाँ का डेटा

जुड़वाँ के IQs की तालिका। हर पंक्ति एक जुड़वाँ जोड़ी दर्शाती है। पहली कॉलम में फोस्टर पेरेंट्स के साथ पले जुड़वाँ का IQ है, और दूसरी कॉलम में बायोलॉजिकल पेरेंट्स के साथ पले जुड़वाँ का IQ है।

R में Linear Regression के लिए Inference

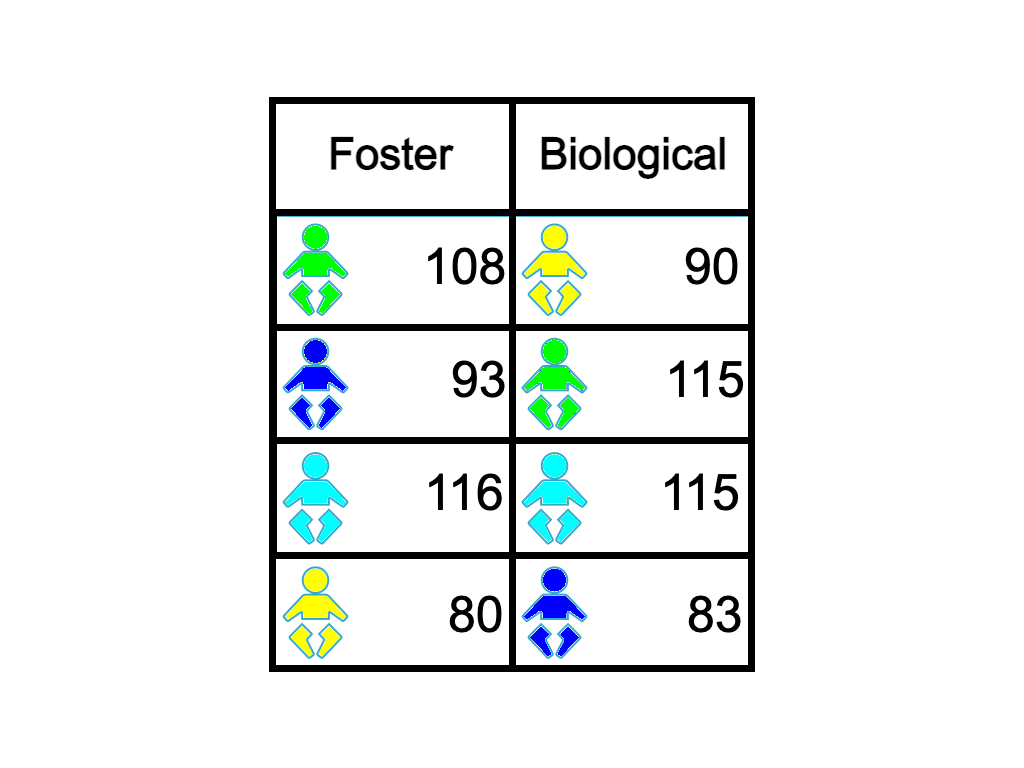
परिम्यूट किया हुआ जुड़वाँ डेटा

जुड़वाँ के IQs की तालिका में प्रत्येक कॉलम को परिम्यूट किया गया है, जिससे जुड़वाँ अब एक ही पंक्ति में साथ नहीं हैं।

R में Linear Regression के लिए Inference

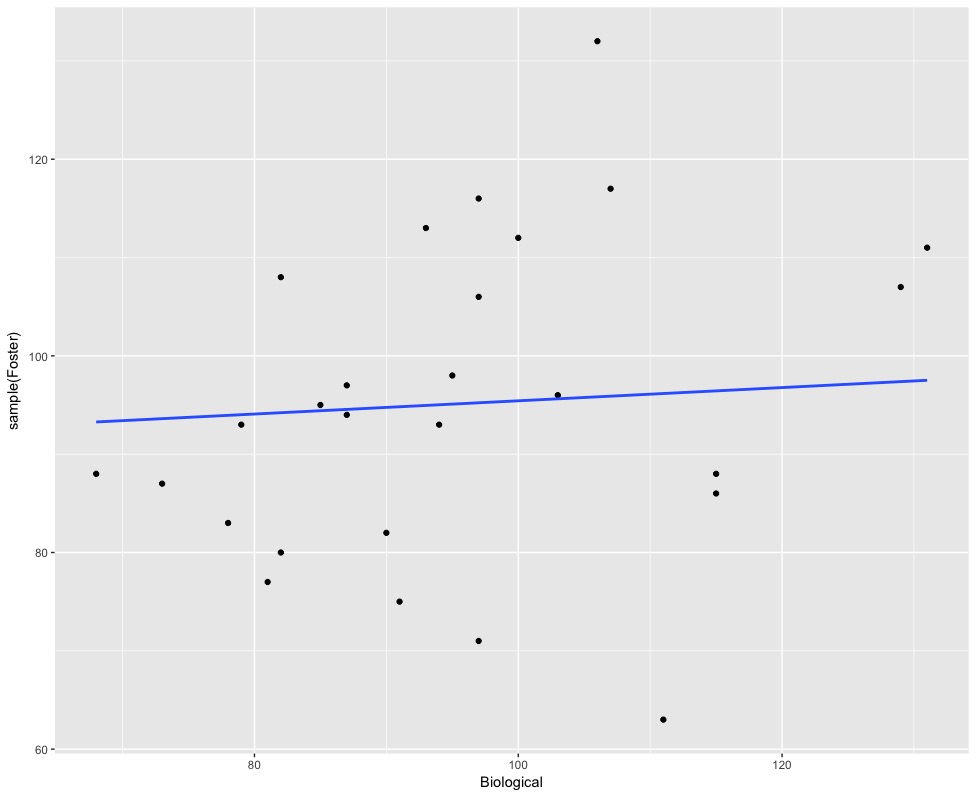
परिम्यूटेड डेटा (1) का प्लॉट

मूल डेटा
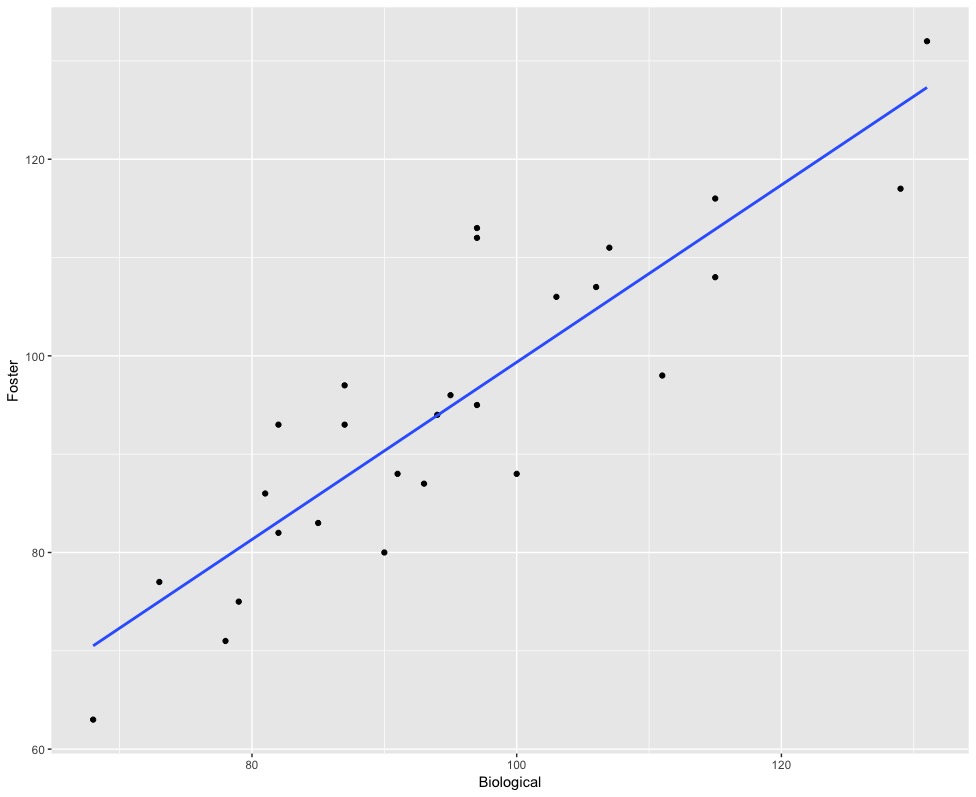
परिम्यूटेड डेटा (1)
R में Linear Regression के लिए Inference

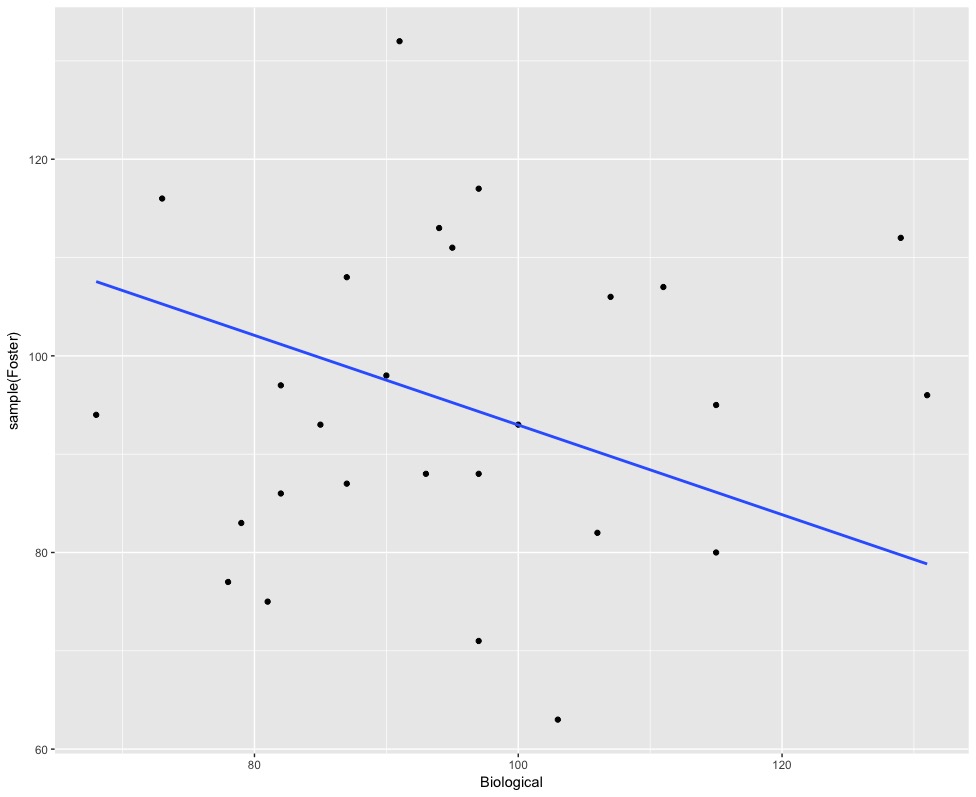
परिम्यूटेड डेटा (2) का प्लॉट

मूल डेटा

परिम्यूटेड डेटा (2)
R में Linear Regression के लिए Inference

परिम्यूटेड डेटा (1) और (2)

परिम्यूटेड डेटा (1)

परिम्यूटेड डेटा (2)

R में Linear Regression के लिए Inference
twins %>%
   specify(Foster ~ Biological) %>%
   hypothesize(null = "independence") %>%
   generate(reps = 10, type = "permute") %>%
   calculate(stat = "slope")
A tibble: 10 x 2
   replicate          stat
       <int>         <dbl>
 1         1  0.0007709302
 2         2 -0.0353592305
 3         3 -0.0278627974
 4         4 -0.0072547982
 5         5 -0.1252761541
 6         6 -0.1669869287
 7         7 -0.2610519170
 8         8 -0.0157695494
 9         9  0.0581361900
10        10  0.1598471947
R में Linear Regression के लिए Inference

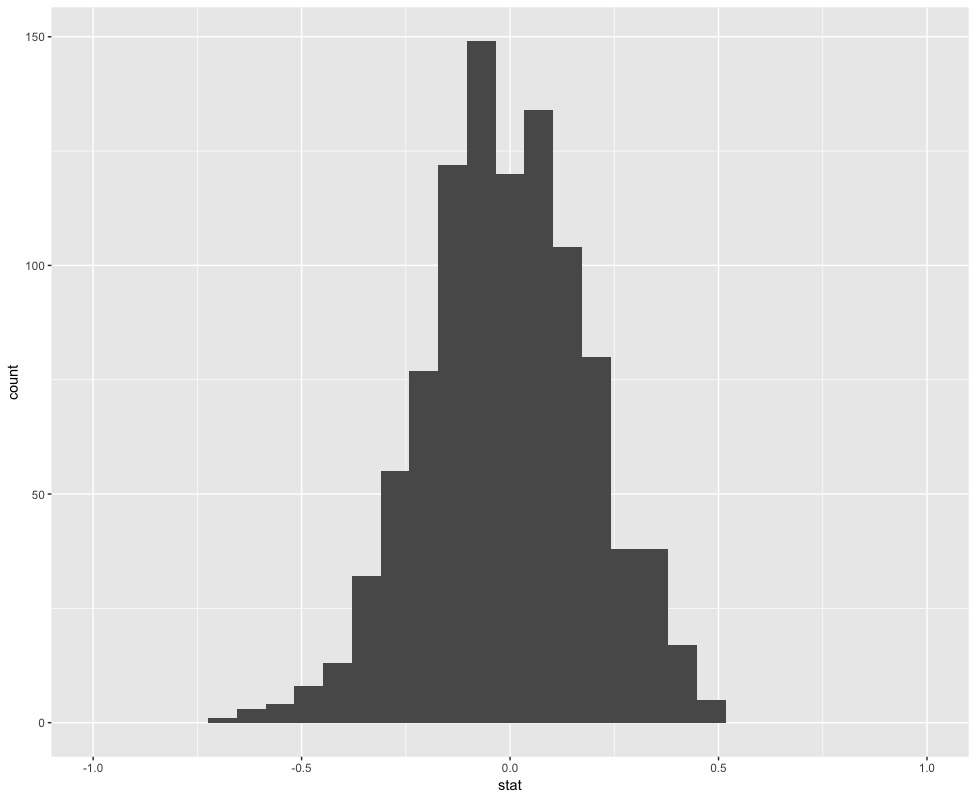
कई परिम्यूटेड स्लोप्स

perm_slope <- twins %>%
   specify(Foster ~ Biological) %>%
   hypothesize(
     null = "independence"
     ) %>%
   generate(reps = 1000, 
            type = "permute") %>%
   calculate(stat = "slope") 

ggplot(data = perm_slope, aes(x = stat)) + 
   geom_histogram() +
   xlim(-1,1)

R में Linear Regression के लिए Inference

परिम्यूटेड स्लोप्स, लाल में observed स्लोप
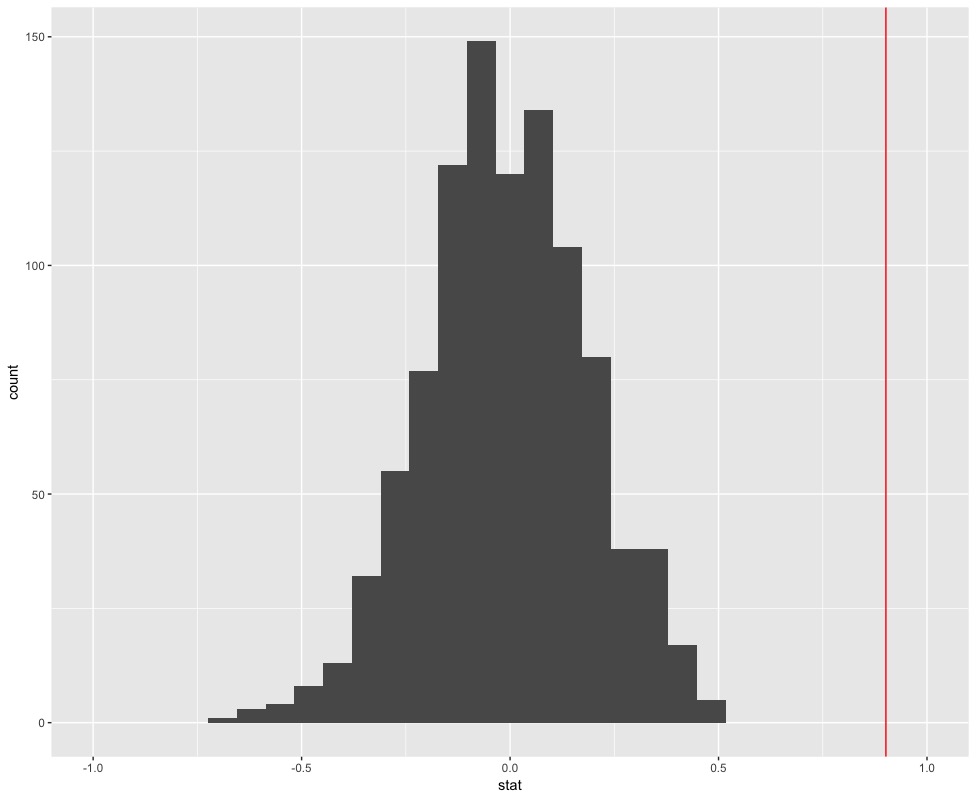
obs_slope <- lm(Foster ~ Biological,
                data = twins) %>%
   tidy() %>%   
   filter(term == "Biological") %>%
   select(estimate) %>%   
   pull()
obs_slope
0.901436
ggplot(data = perm_slope, aes(x = stat)) + 
   geom_histogram() +
   geom_vline(xintercept = obs_slope, color = "red") 
   + xlim(-1,1)

R में Linear Regression के लिए Inference

अभ्यास करते हैं!

R में Linear Regression के लिए Inference

Preparing Video For Download...