Tidyverse में डेटा के साथ Modeling
Albert Y. Kim
Assistant Professor of Statistical and Data Sciences
$$
$$y = f(\vec{x}) + \epsilon$$
Where:
मॉडलिंग के उद्देश्य:
टेक्सास यूनिवर्सिटी, ऑस्टिन का टीचिंग इवैल्यूएशन स्कोर पर अध्ययन (openintro.org)।
प्रश्न: क्या हम विभिन्न शिक्षक गुणों के आधार पर टीचिंग इवैल्यूएशन स्कोर में अंतर समझा सकते हैं?
वैरिएबल्स:
scorerank, gender, age, और bty_avg जैसे गुणmoderndive पैकेज से ModernDive.com हेतु:
library(dplyr)
library(moderndive)
glimpse(evals)
Observations: 463
Variables: 13
$ ID <int> 1, 2, 3, 4, 5, 6, 7, 8, 9, 10...
$ score <dbl> 4.7, 4.1, 3.9, 4.8, 4.6, 4.3...
$ age <int> 36, 36, 36, 36, 59, 59, 59, 51...
$ bty_avg <dbl> 5.000, 5.000, 5.000, 5.000...
$ gender <fct> female, female, female, female...
...
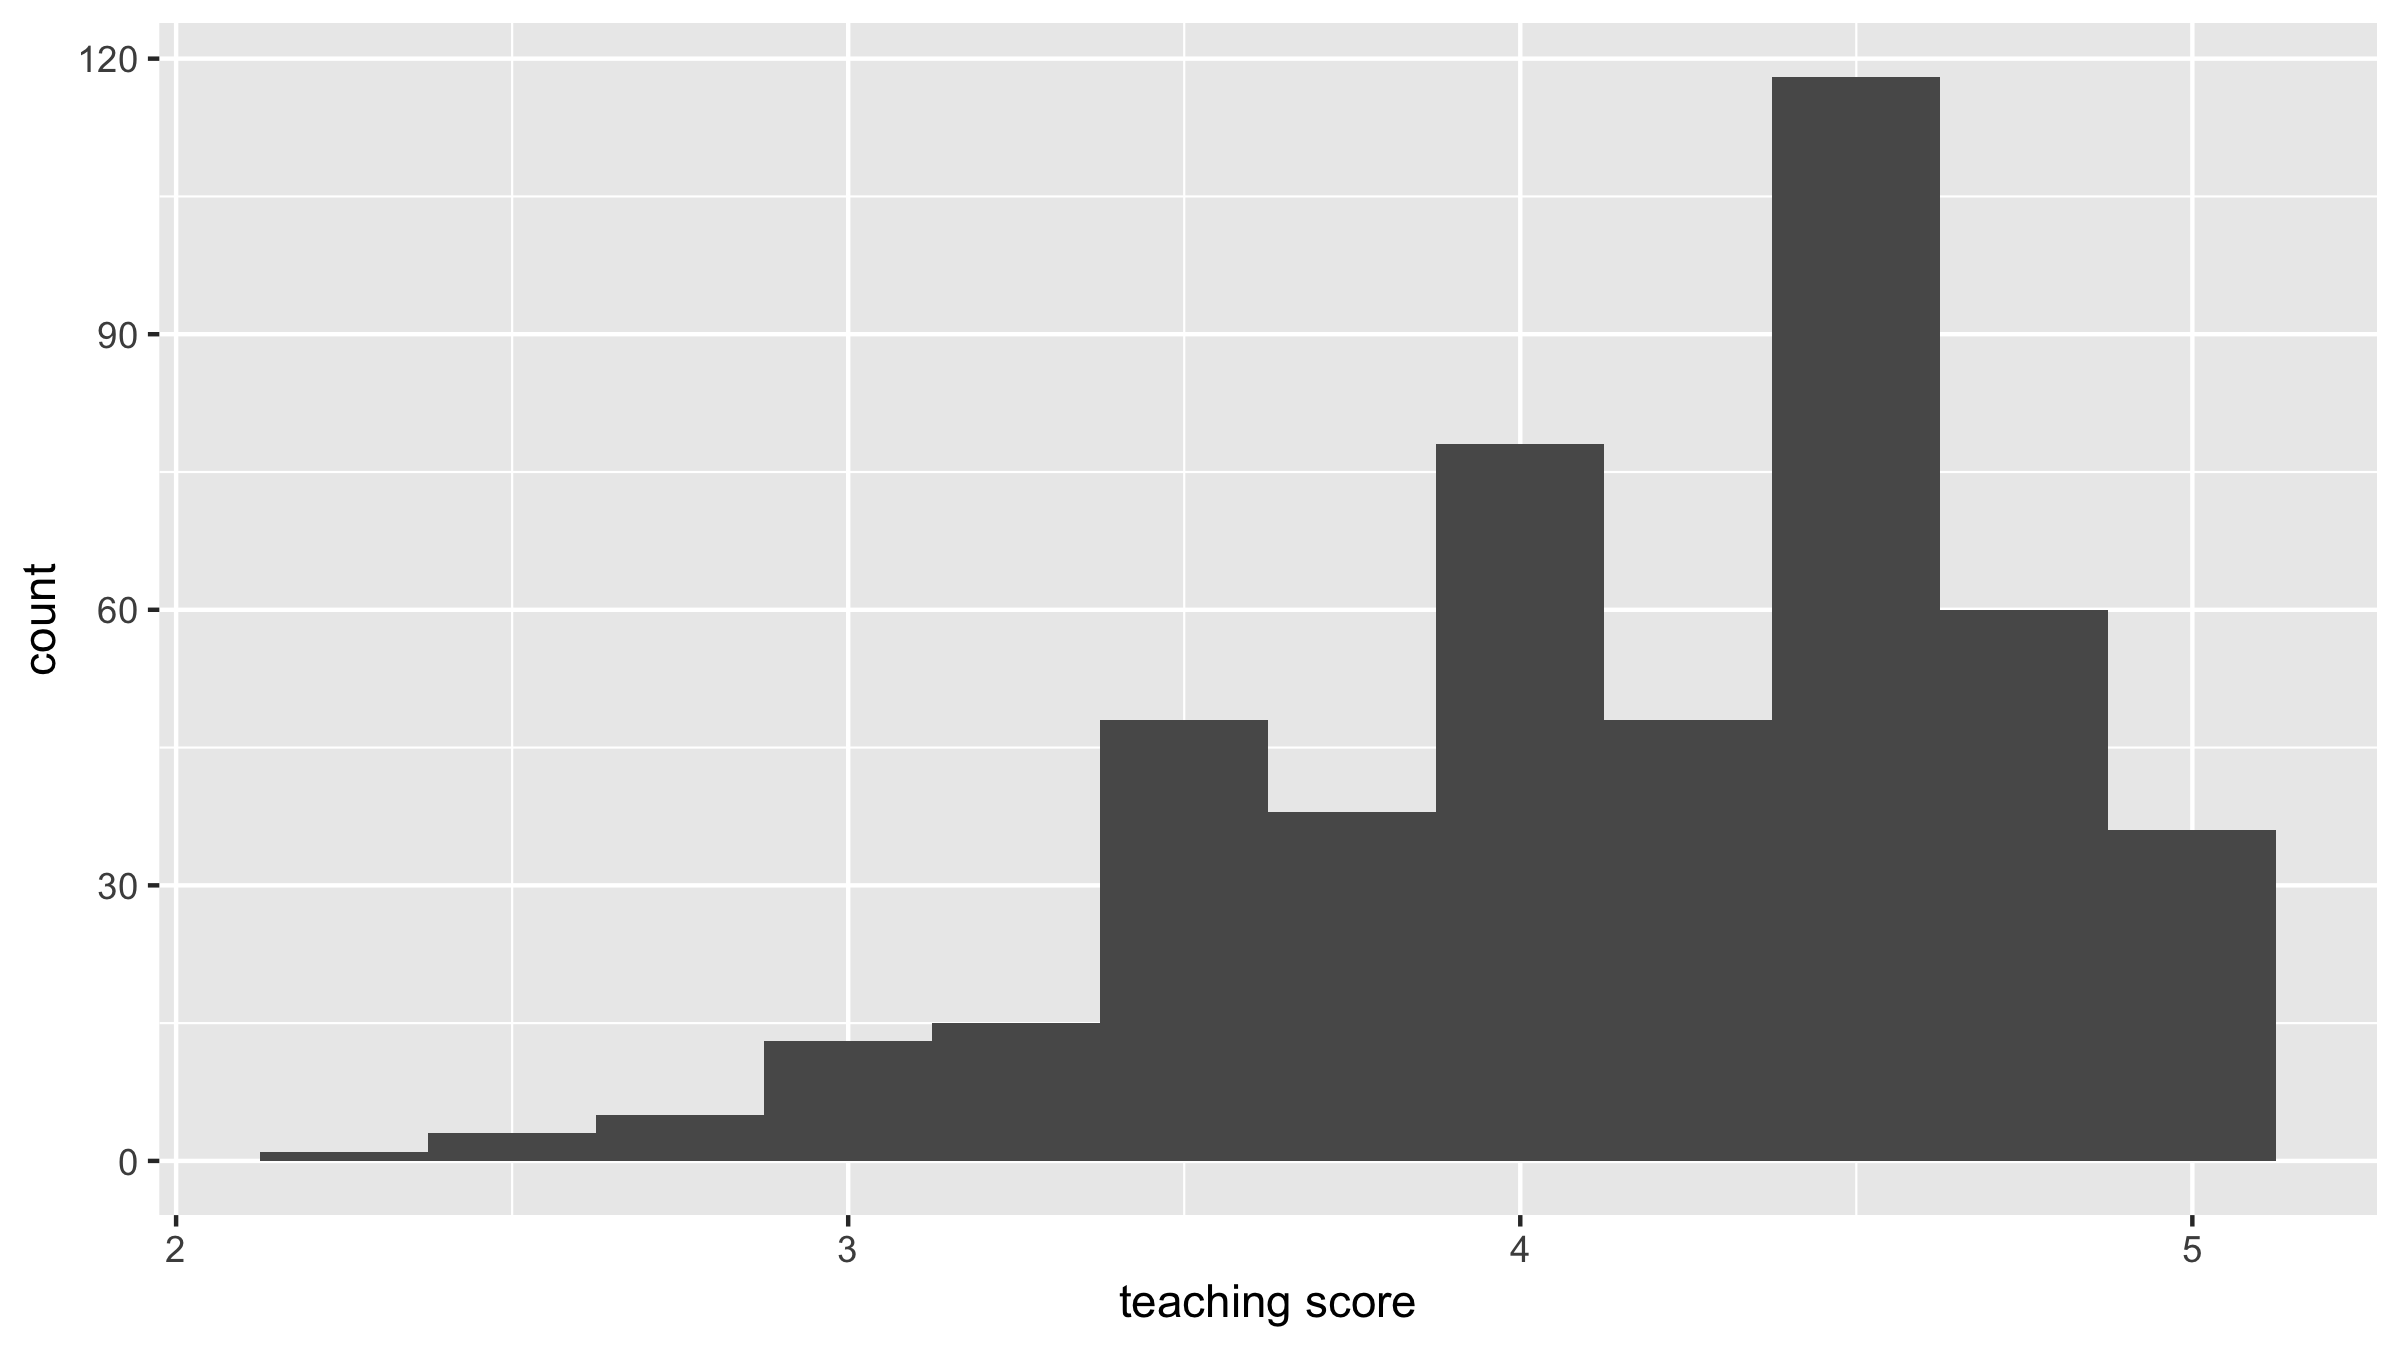
एक्सप्लोरेटरी डेटा एनालिसिस (EDA) के तीन मूल चरण:
library(ggplot2)
ggplot(evals, aes(x = score)) +
geom_histogram(binwidth = 0.25) +
labs(x = "teaching score", y = "count")

# Compute mean, median, and standard deviation
evals %>%
summarize(mean_score = mean(score),
median_score = median(score),
sd_score = sd(score))
# A tibble: 1 x 3
mean_score median_score sd_score
<dbl> <dbl> <dbl>
1 4.17 4.3 0.544
Tidyverse में डेटा के साथ Modeling