Tidyverse में डेटा के साथ Modeling
Albert Y. Kim
Assistant Professor of Statistical and Data Sciences
सीएटल के पास, वॉशिंगटन स्टेट के किंग काउंटी के हाउस प्राइसेज़ का एक डेटासेट (Kaggle.com पर उपलब्ध).
प्रश्न: क्या हम फीचर्स के आधार पर घर की बिक्री कीमत प्रिडिक्ट कर सकते हैं?
वैरिएबल्स:
price US dollars मेंsqft_living, condition, bedrooms, yr_built, waterfrontmoderndive पैकेज से ModernDive के लिए:
library(dplyr)
library(moderndive)
glimpse(house_prices)
Observations: 21,613
Variables: 21
$ id <chr> "7129300520", "6414100192"...
$ date <dttm> 2014-10-13, 2014-12-09, 2015...
$ price <dbl> 221900, 538000, 180000, 604000...
...
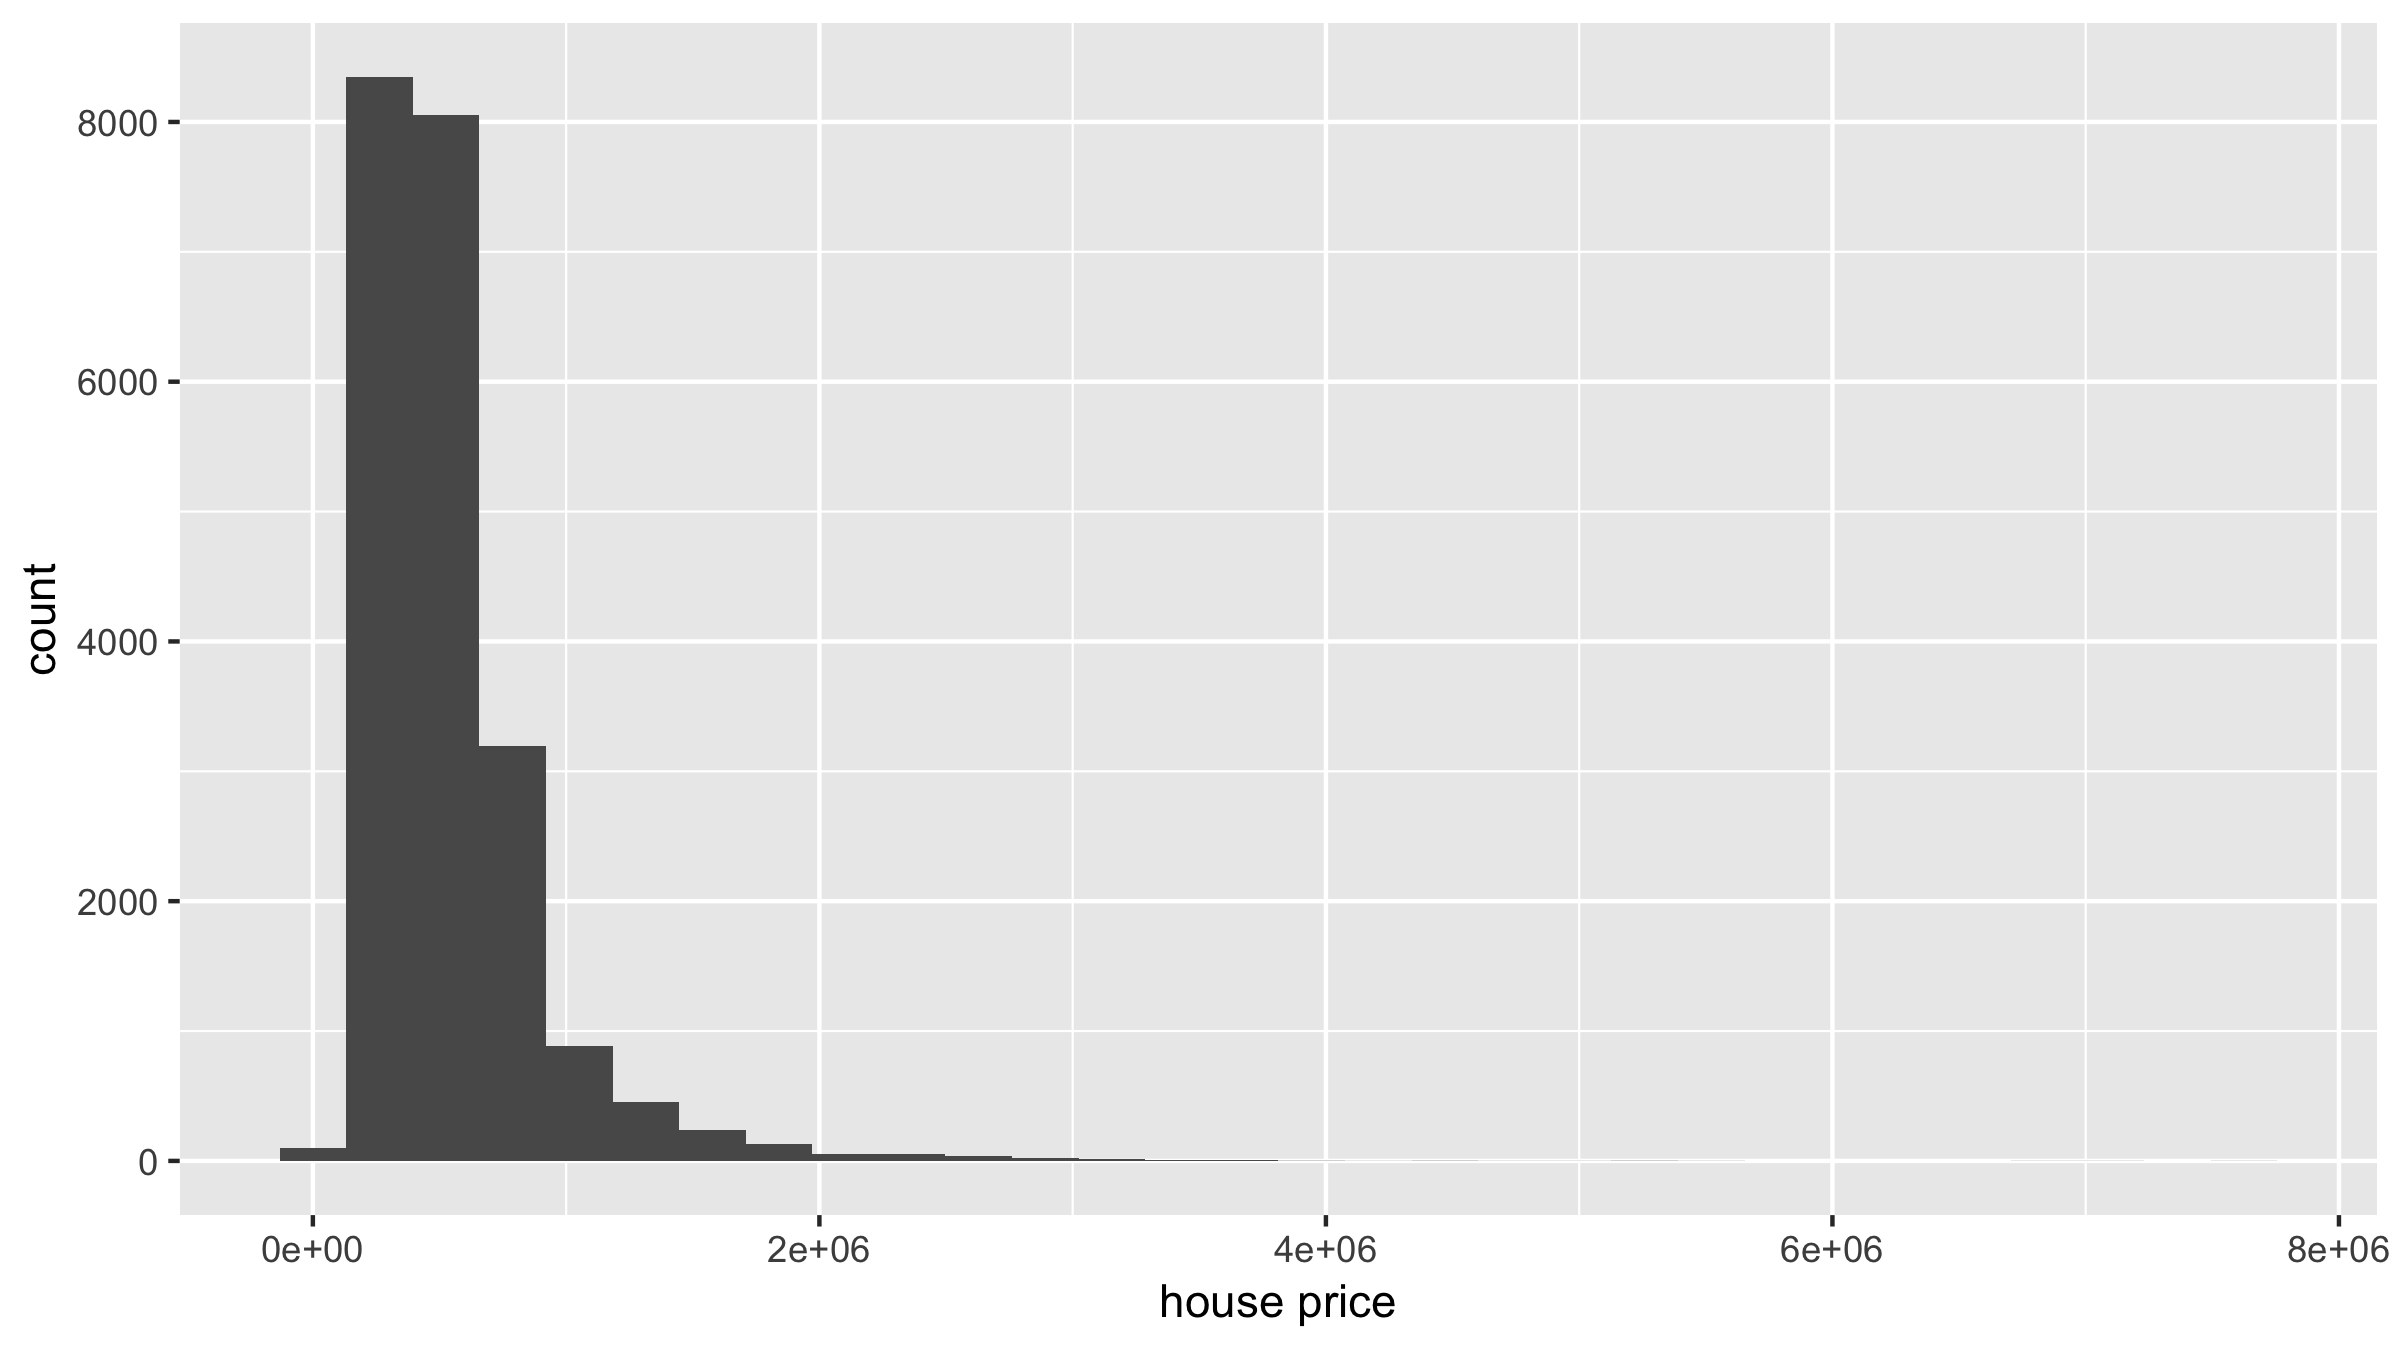
library(ggplot2)
ggplot(house_prices, aes(x = price)) +
geom_histogram() +
labs(x = "house price", y = "count")


# log10() transform price and size
house_prices <- house_prices %>%
mutate(log10_price = log10(price)) %>%
select(price, log10_price)
# A tibble: 21,613 x 2
price log10_price
<dbl> <dbl>
1 221900 5.35
2 538000 5.73
3 180000 5.26
4 604000 5.78
5 510000 5.71
6 1225000 6.09
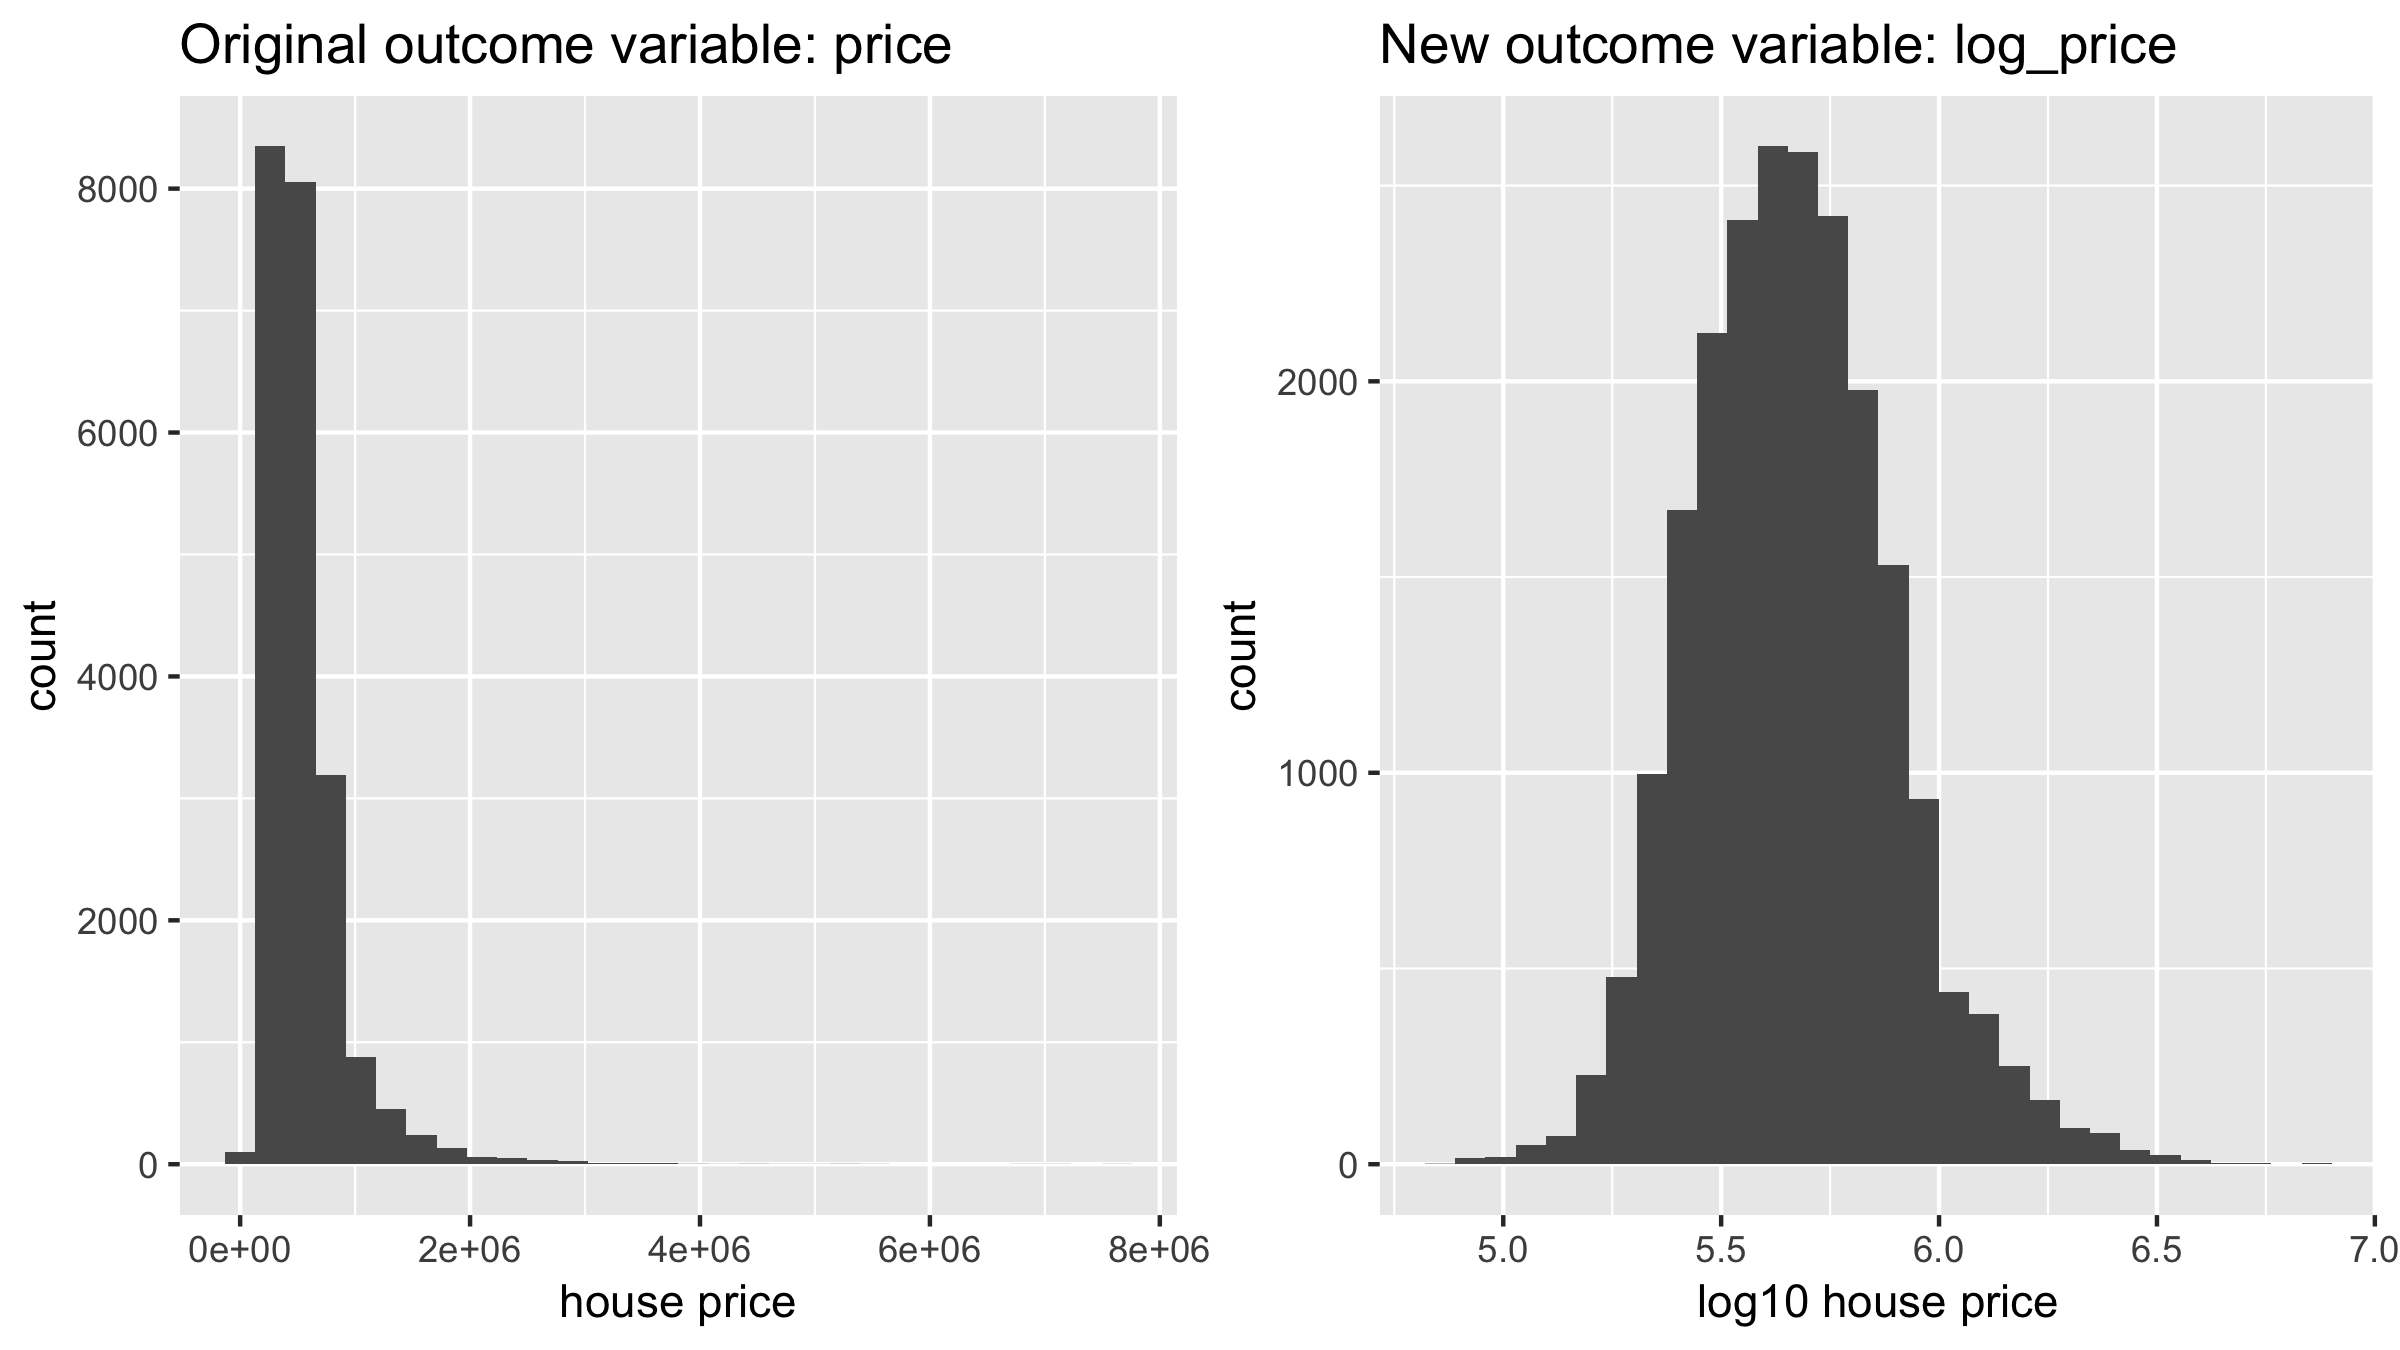
# Histogram of original outcome variable
ggplot(house_prices, aes(x = price)) +
geom_histogram() +
labs(x = "house price", y = "count")
# Histogram of new, log10-transformed outcome variable
ggplot(house_prices, aes(x = log10_price)) +
geom_histogram() +
labs(x = "log10 house price", y = "count")

Tidyverse में डेटा के साथ Modeling