उम्र से teaching score समझना

Tidyverse में डेटा के साथ Modeling

Albert Y. Kim

Assistant Professor of Statistical and Data Sciences

रिफ्रेशर: Exploratory data visualization
Tidyverse में डेटा के साथ Modeling

Regression line

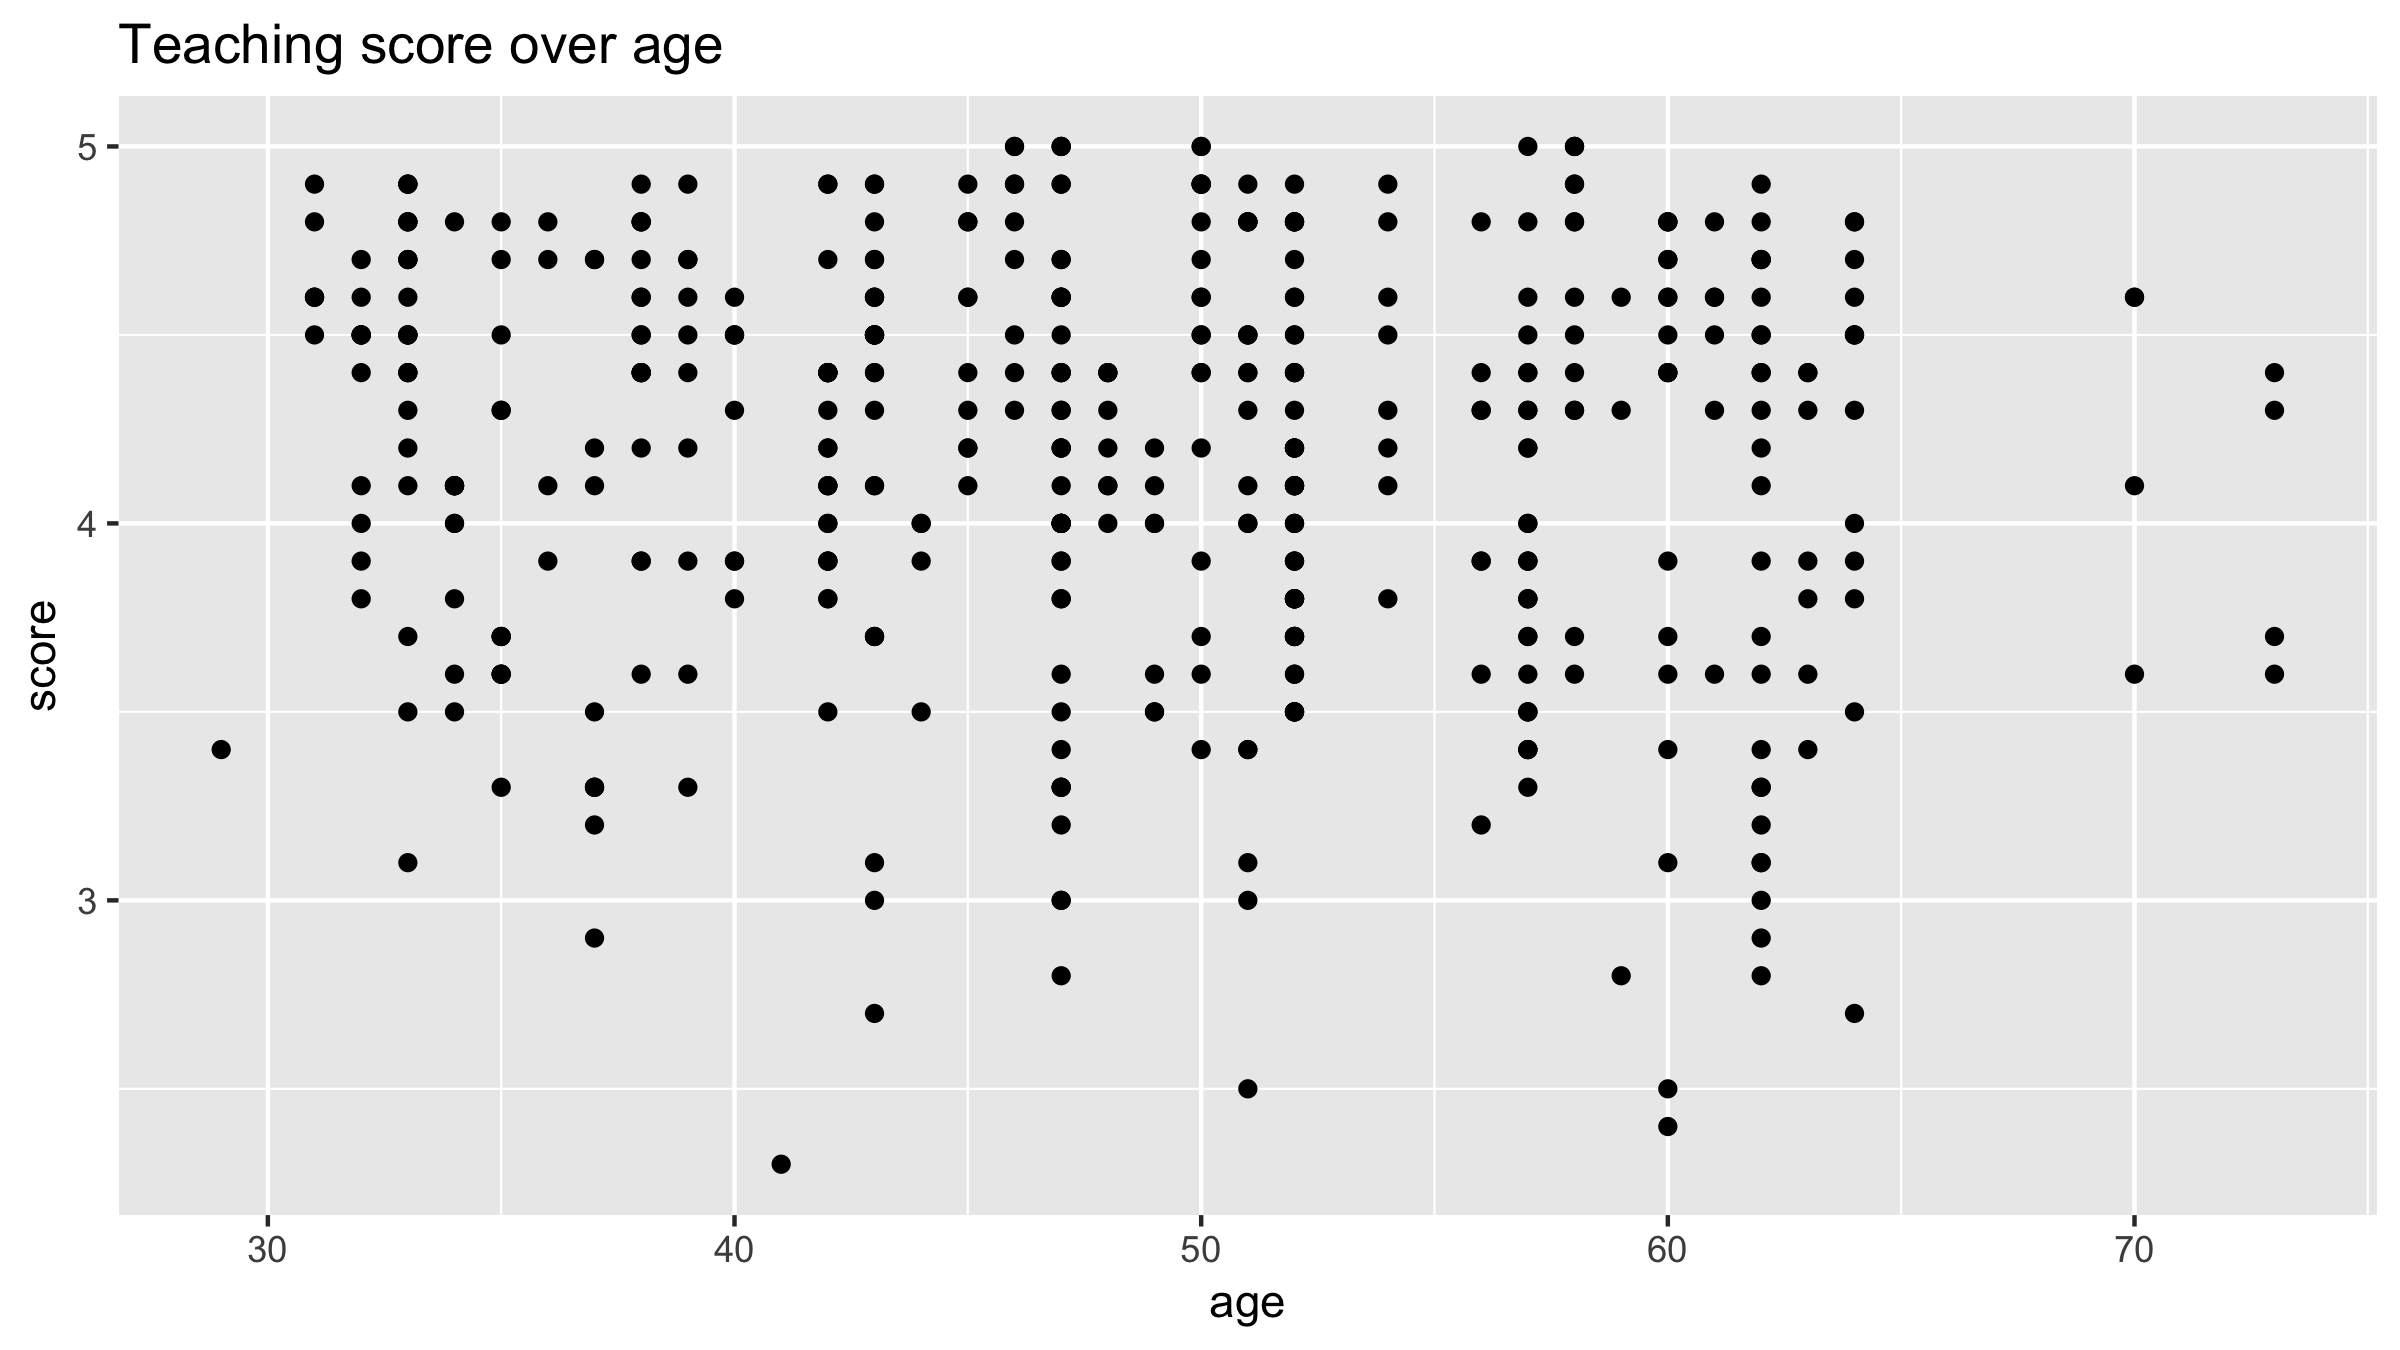
# Code to create scatterplot
ggplot(evals, aes(x = age, y = score)) +
  geom_point() + 
  labs(x = "age", y = "score", 
       title = "Teaching score over age")

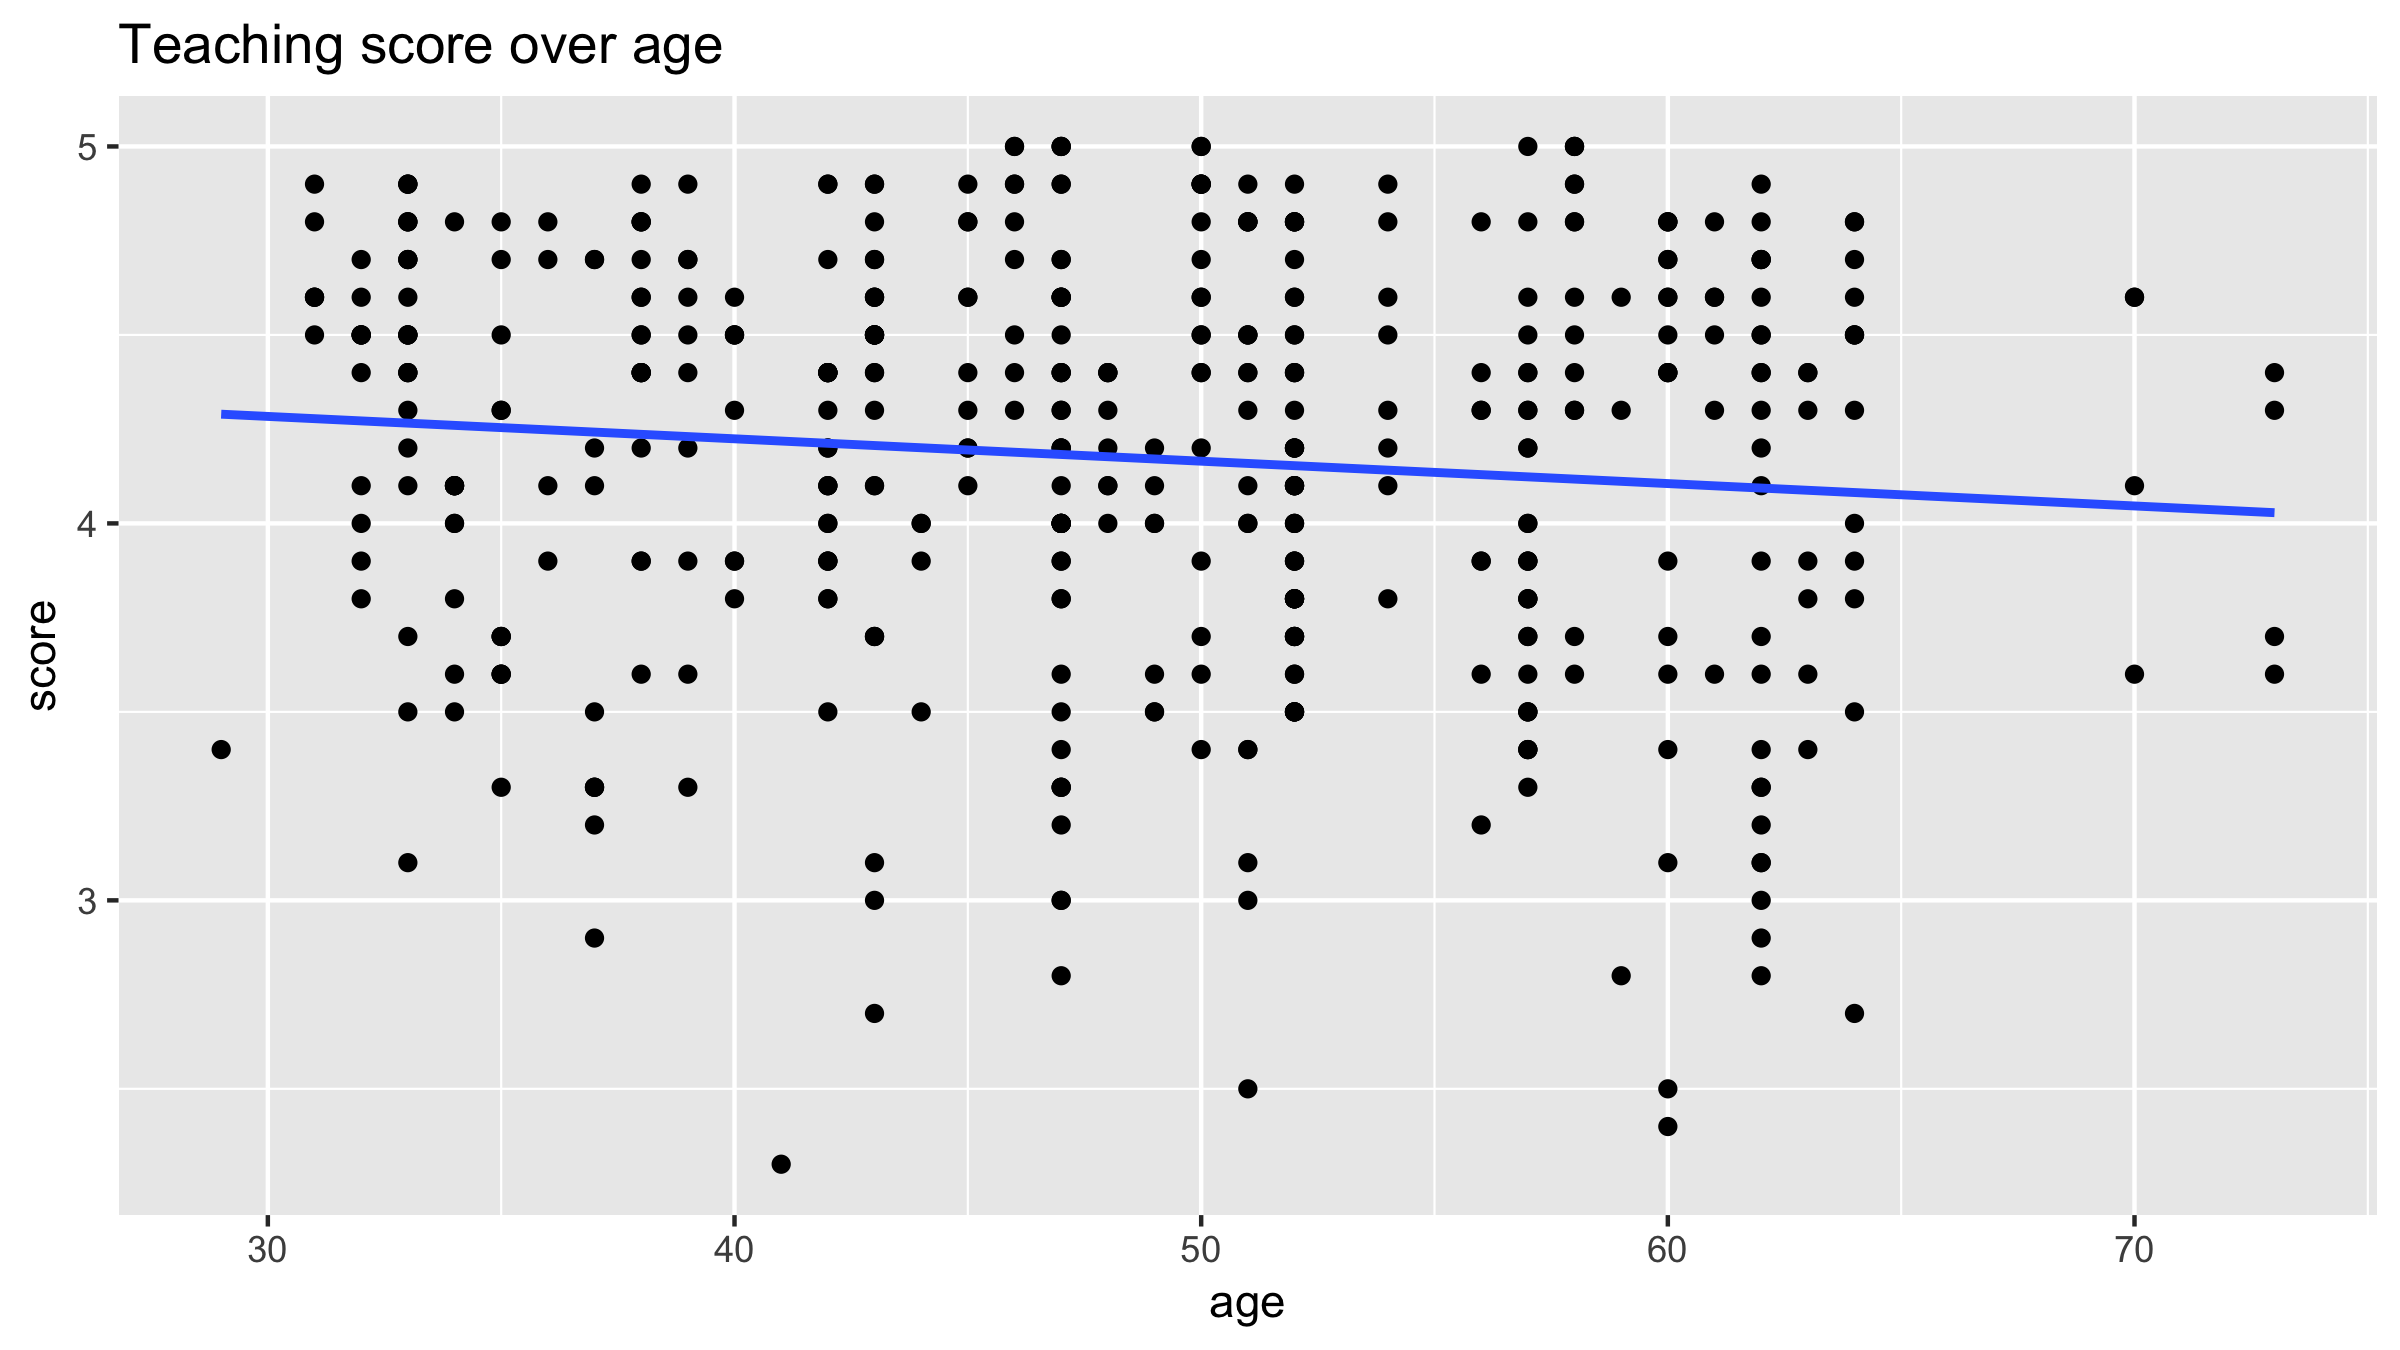
# Add a "best-fitting" line ggplot(evals, aes(x = age, y = score)) + geom_point() + labs(x = "age", y = "score", title = "Teaching score over age") + geom_smooth(method = "lm", se = FALSE)
Tidyverse में डेटा के साथ Modeling

Regression line

Tidyverse में डेटा के साथ Modeling

रिफ्रेशर: सामान्य modeling

  • सत्य: मान्य मॉडल $y = f(\vec{x}) + \epsilon$
  • लक्ष्य: दिए गए $y$ और $\vec{x}$ पर, ऐसा मॉडल $\hat{f}(\vec{x})$ फिट करें जो $f(\vec{x})$ को लगभग दे. जहाँ $\hat{y} = \hat{f}(\vec{x})$ observed मान $y$ का fitted/predicted मान है
Tidyverse में डेटा के साथ Modeling

बेसिक linear regression से modeling

  • सत्य:
    • मानें $f(x) = \beta_0 + \beta_1 \cdot x$
    • Observed मान $y = f(x) + \epsilon = \beta_0 + \beta_1 \cdot x + \epsilon$
  • Fitted:
    • मानें $\hat{f}(x) = \hat{\beta}_0 + \hat{\beta}_1 \cdot x$
    • Fitted/predicted मान $\hat{y} = \hat{f}(x) = \hat{\beta}_0 + \hat{\beta}_1 \cdot x$
Tidyverse में डेटा के साथ Modeling

फिर से regression रेखा पर

फिट की गई नीली regression रेखा का समीकरण: $\hat{y} = \hat{f}(\vec{x}) = \hat{\beta}_0 + \hat{\beta}_1 \cdot x$

Tidyverse में डेटा के साथ Modeling

Regression रेखा का slope और intercept निकालना

Formula रूप y ~ x का उपयोग:

# Fit regression model using formula of form: y ~ x
model_score_1 <- lm(score ~ age, data = evals)

# Output contents model_score_1
Call:
lm(formula = score ~ age, data = evals)

Coefficients:
(Intercept)          age  
   4.461932    -0.005938
Tidyverse में डेटा के साथ Modeling

Regression रेखा का slope और intercept निकालना

Formula रूप y ~ x का उपयोग, जो $\hat{y}= \hat{f}(\vec{x})$ जैसा है

# Fit regression model using formula of form: y ~ x
model_score_1 <- lm(score ~ age, data = evals)

# Output regression table using wrapper function:
get_regression_table(model_score_1)
# A tibble: 2 x 7
  term      estimate std_error statistic p_value...
  <chr^>        <dbl>     <dbl>     <dbl>   <dbl>... 
1 intercept    4.46      0.127     35.2    0...
2 age         -0.006     0.003     -2.31   0.021...
Tidyverse में डेटा के साथ Modeling

अभ्यास करते हैं!

Tidyverse में डेटा के साथ Modeling

Preparing Video For Download...