व्याख्या के लिए मॉडलिंग समस्या

Tidyverse में डेटा के साथ Modeling

Albert Y. Kim

Assistant Professor of Statistical and Data Sciences

याद करें: सामान्य मॉडलिंग फ्रेमवर्क फ़ॉर्मूला

$$ y = f(\vec{x}) + \epsilon $$

जहाँ:

  • $y$: रुचि का outcome वैरिएबल
  • $\vec{x}$: explanatory/predictor वैरिएबल्स
  • $f()$: $y$ और $\vec{x}$ के बीच संबंध का function, जिसे signal भी कहते हैं
  • $\epsilon$: असंगठित error घटक, जिसे noise भी कहते हैं
Tidyverse में डेटा के साथ Modeling

मॉडलिंग समस्या

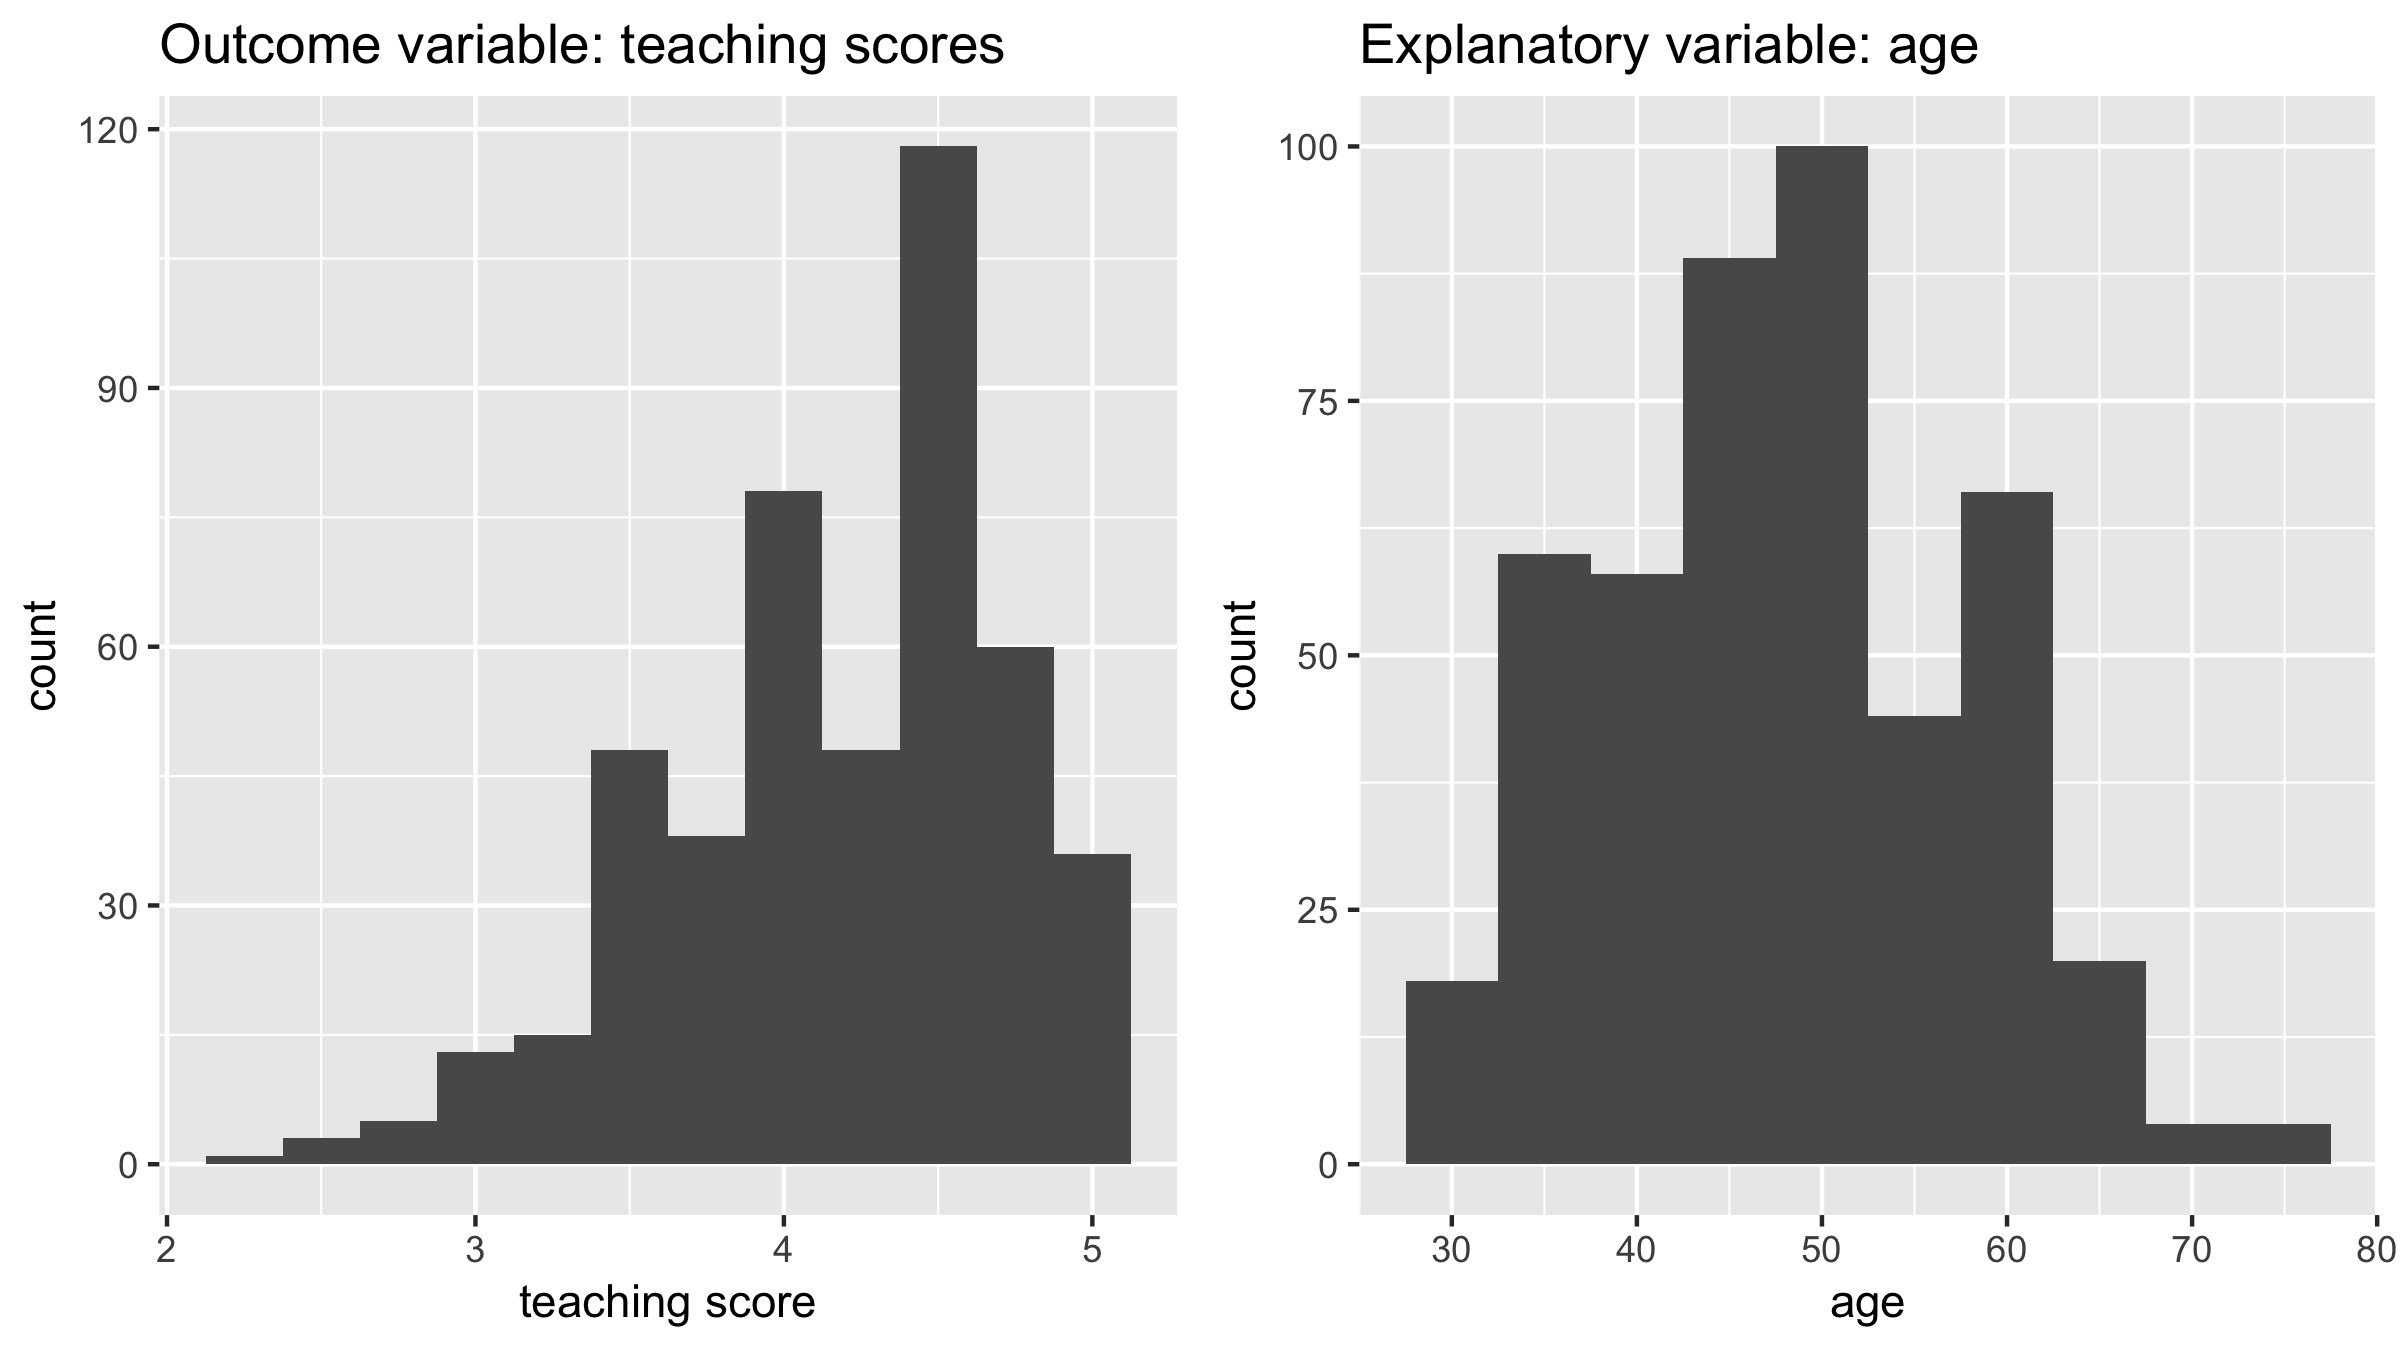
सोचें $y = f(\vec{x}) + \epsilon$.

  1. $f()$ और $\epsilon$ अज्ञात हैं
  2. डेटा में $y$ और $\vec{x}$ के $n$ observations दिए/ज्ञात हैं
  3. उद्देश्य: ऐसा मॉडल $\hat{f}()$ फिट करें जो $f()$ को approximate करे और $\epsilon$ को अनदेखा करे
  4. उद्देश्य पुनः: signal को noise से अलग करें
  5. फिर fitted/predicted मान $\hat{y} = \hat{f}(\vec{x})$ बना सकते हैं
Tidyverse में डेटा के साथ Modeling

व्याख्या हेतु मॉडलिंग उदाहरण

Tidyverse में डेटा के साथ Modeling

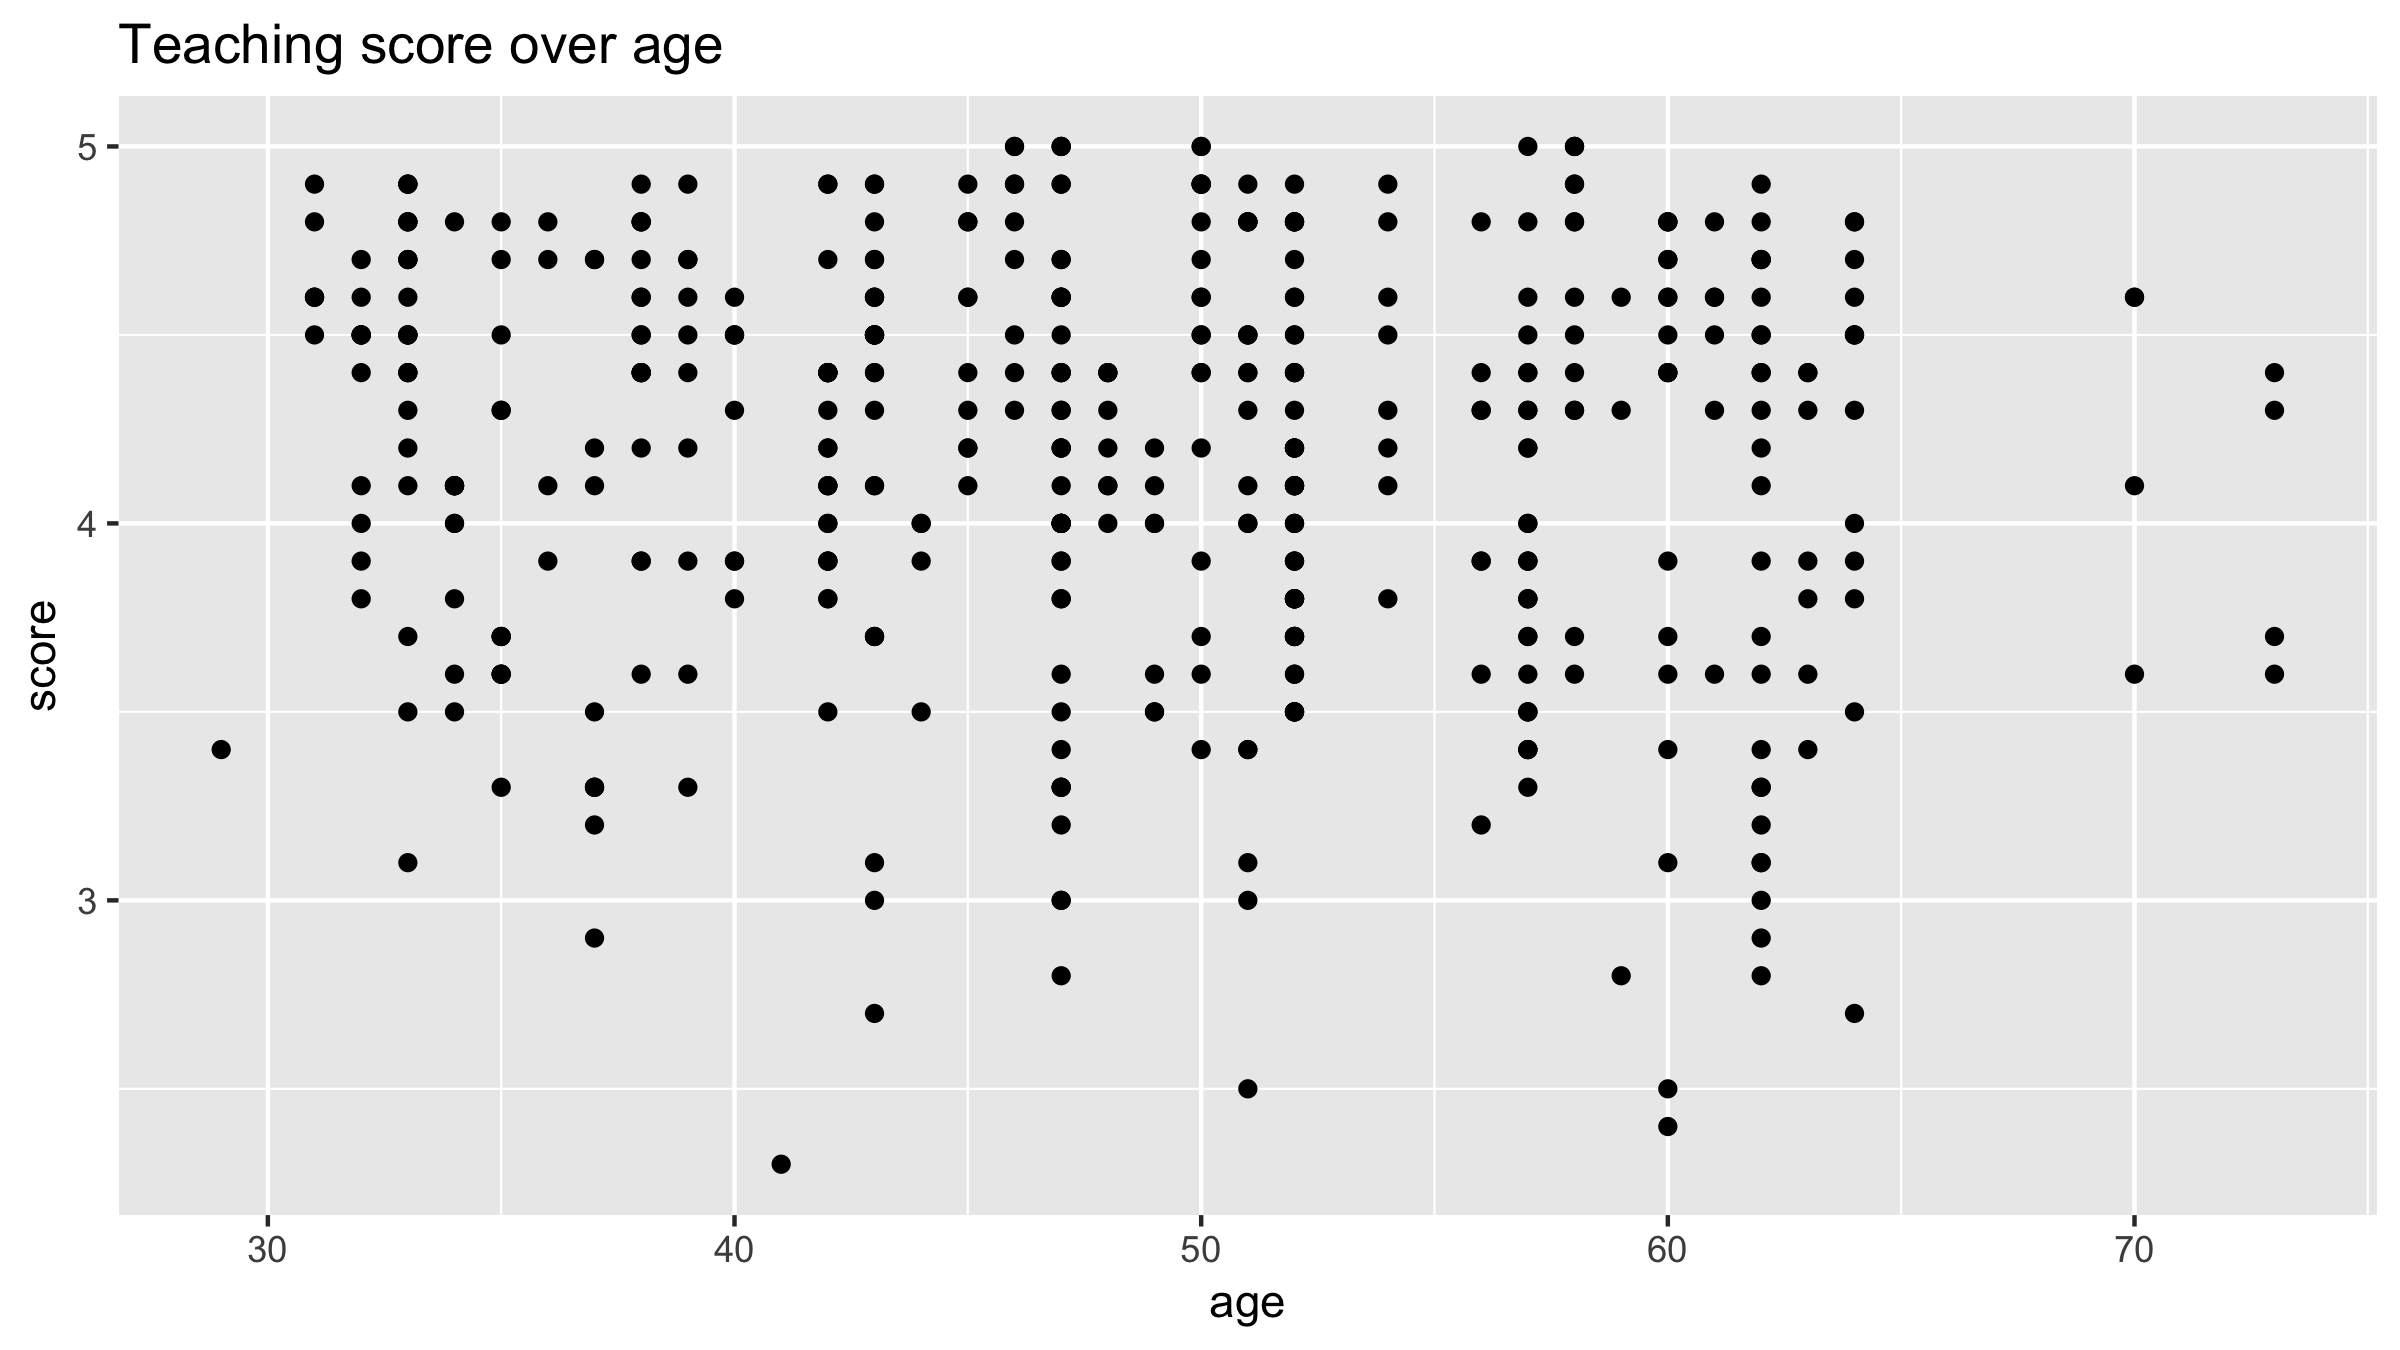
संबंध का EDA

library(ggplot2)
library(dplyr)
library(moderndive)

ggplot(evals, aes(x = age, y = score)) +
  geom_point() + 
  labs(x = "age", y = "score",
       title = "Teaching score over age")
Tidyverse में डेटा के साथ Modeling

संबंध का EDA

Tidyverse में डेटा के साथ Modeling

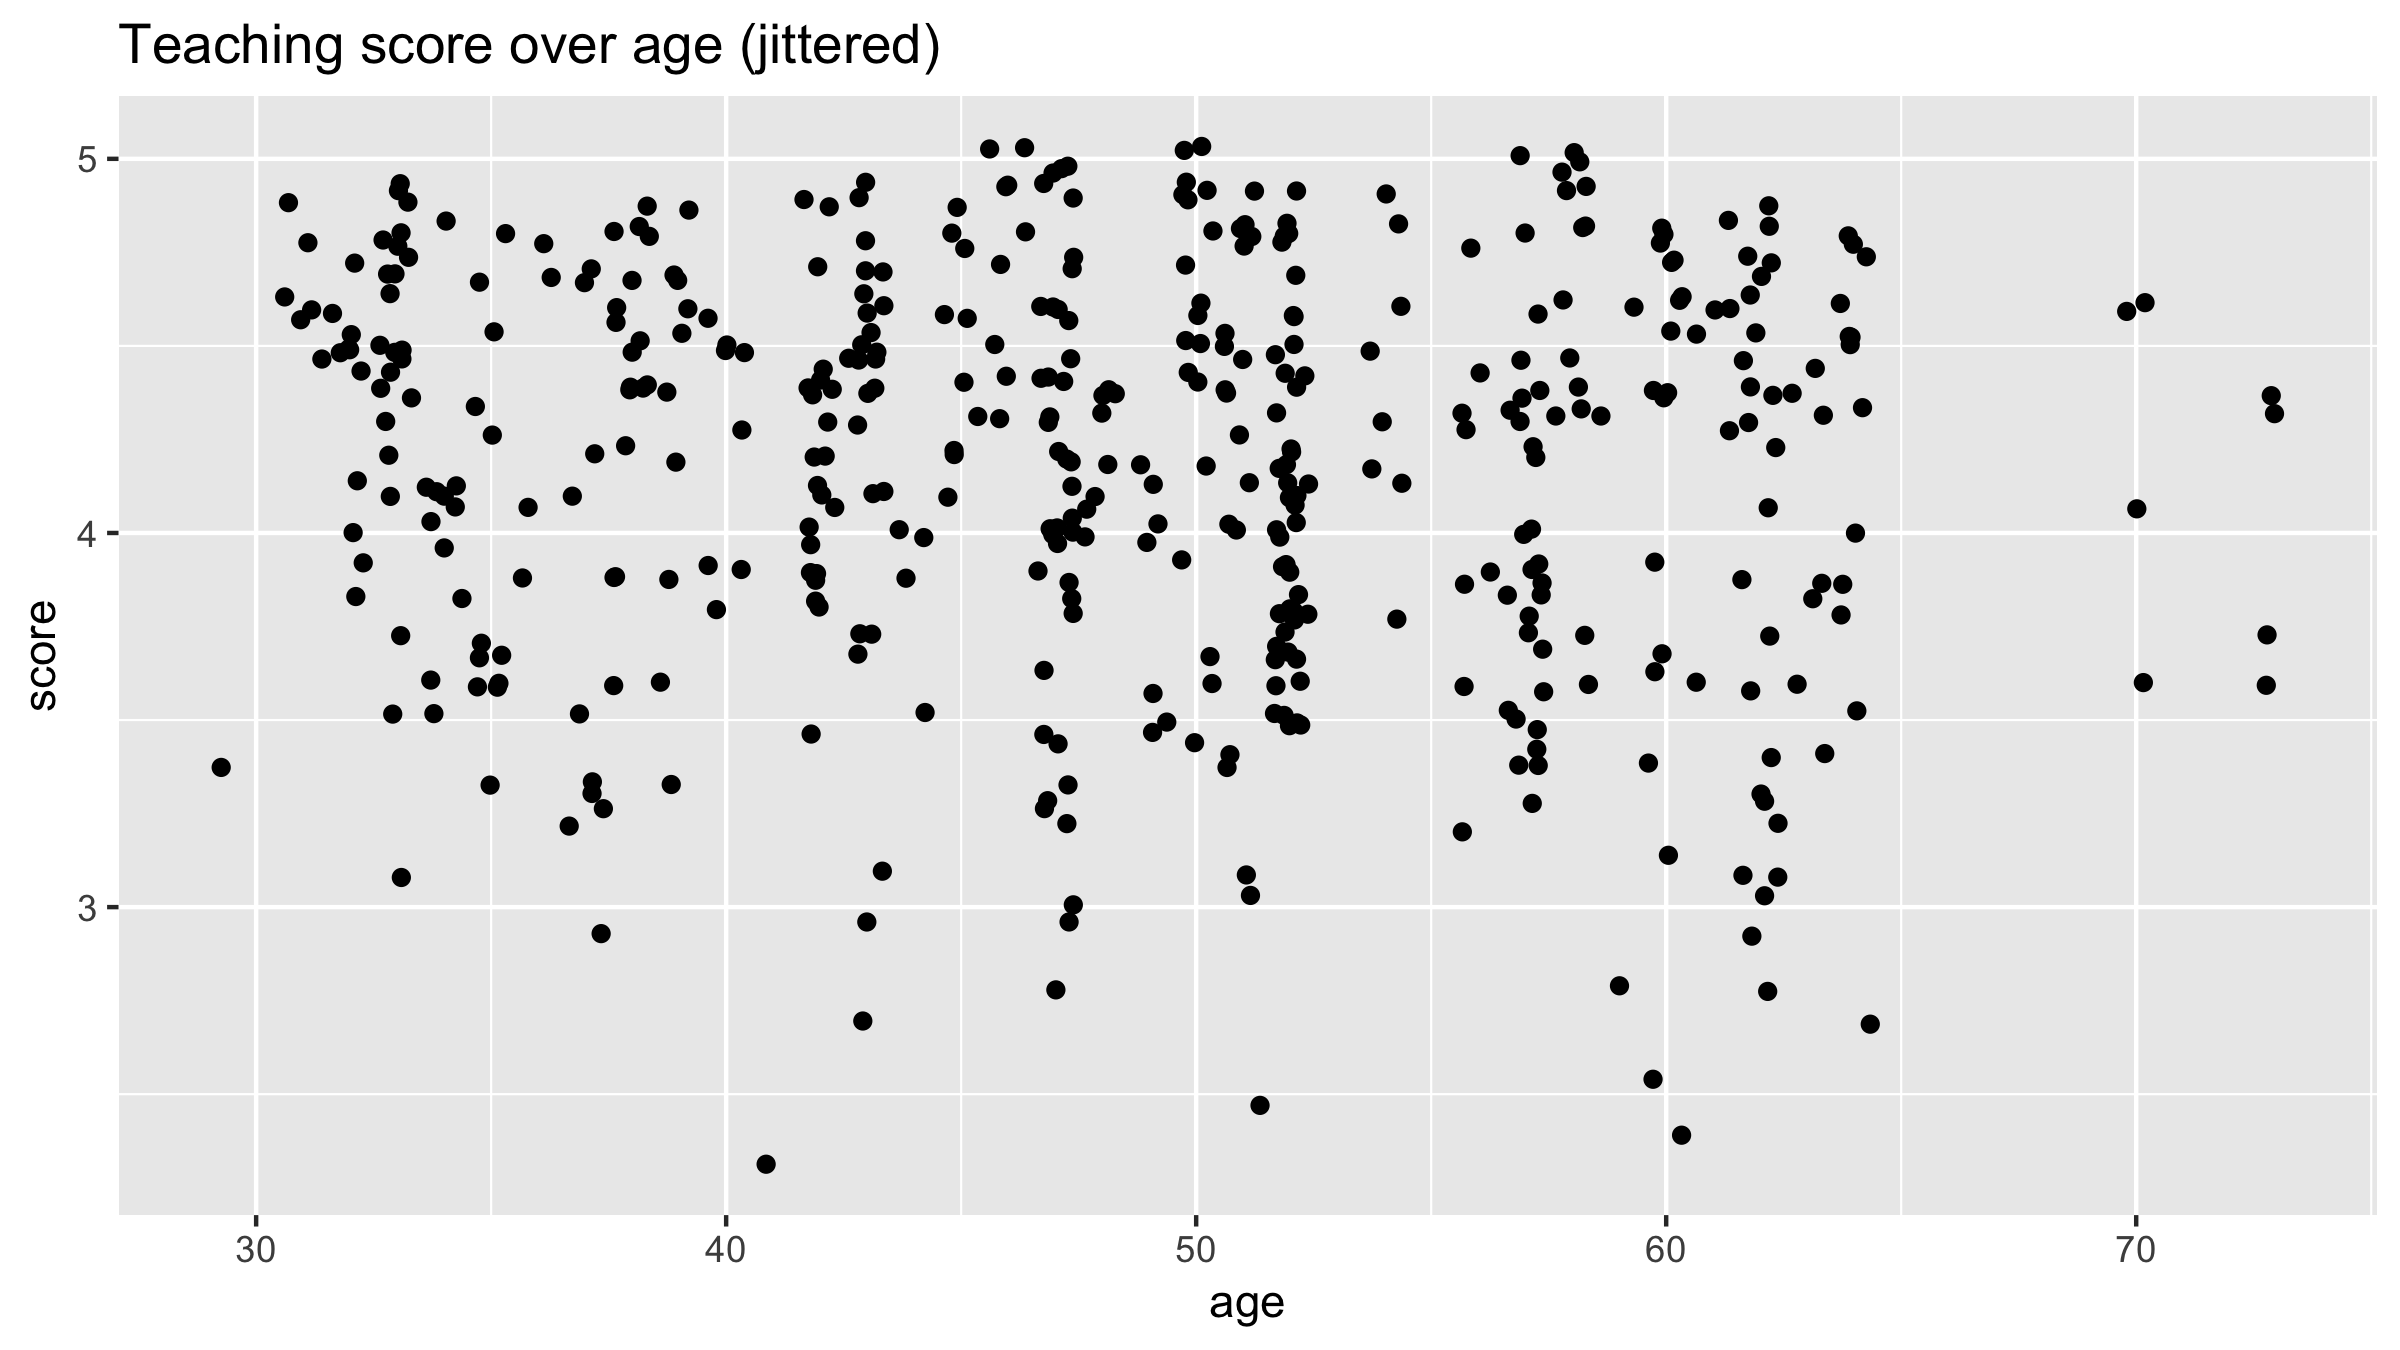
जिटर किया हुआ स्कैटरप्लॉट

library(ggplot2)
library(dplyr)
library(moderndive)

# Use geom_jitter() instead of geom_point()
ggplot(evals, aes(x = age, y = score)) +
  geom_jitter() + 
  labs(x = "age", y = "score",
       title = "Teaching score over age (jittered)")
Tidyverse में डेटा के साथ Modeling

जिटर किया हुआ स्कैटरप्लॉट

Tidyverse में डेटा के साथ Modeling

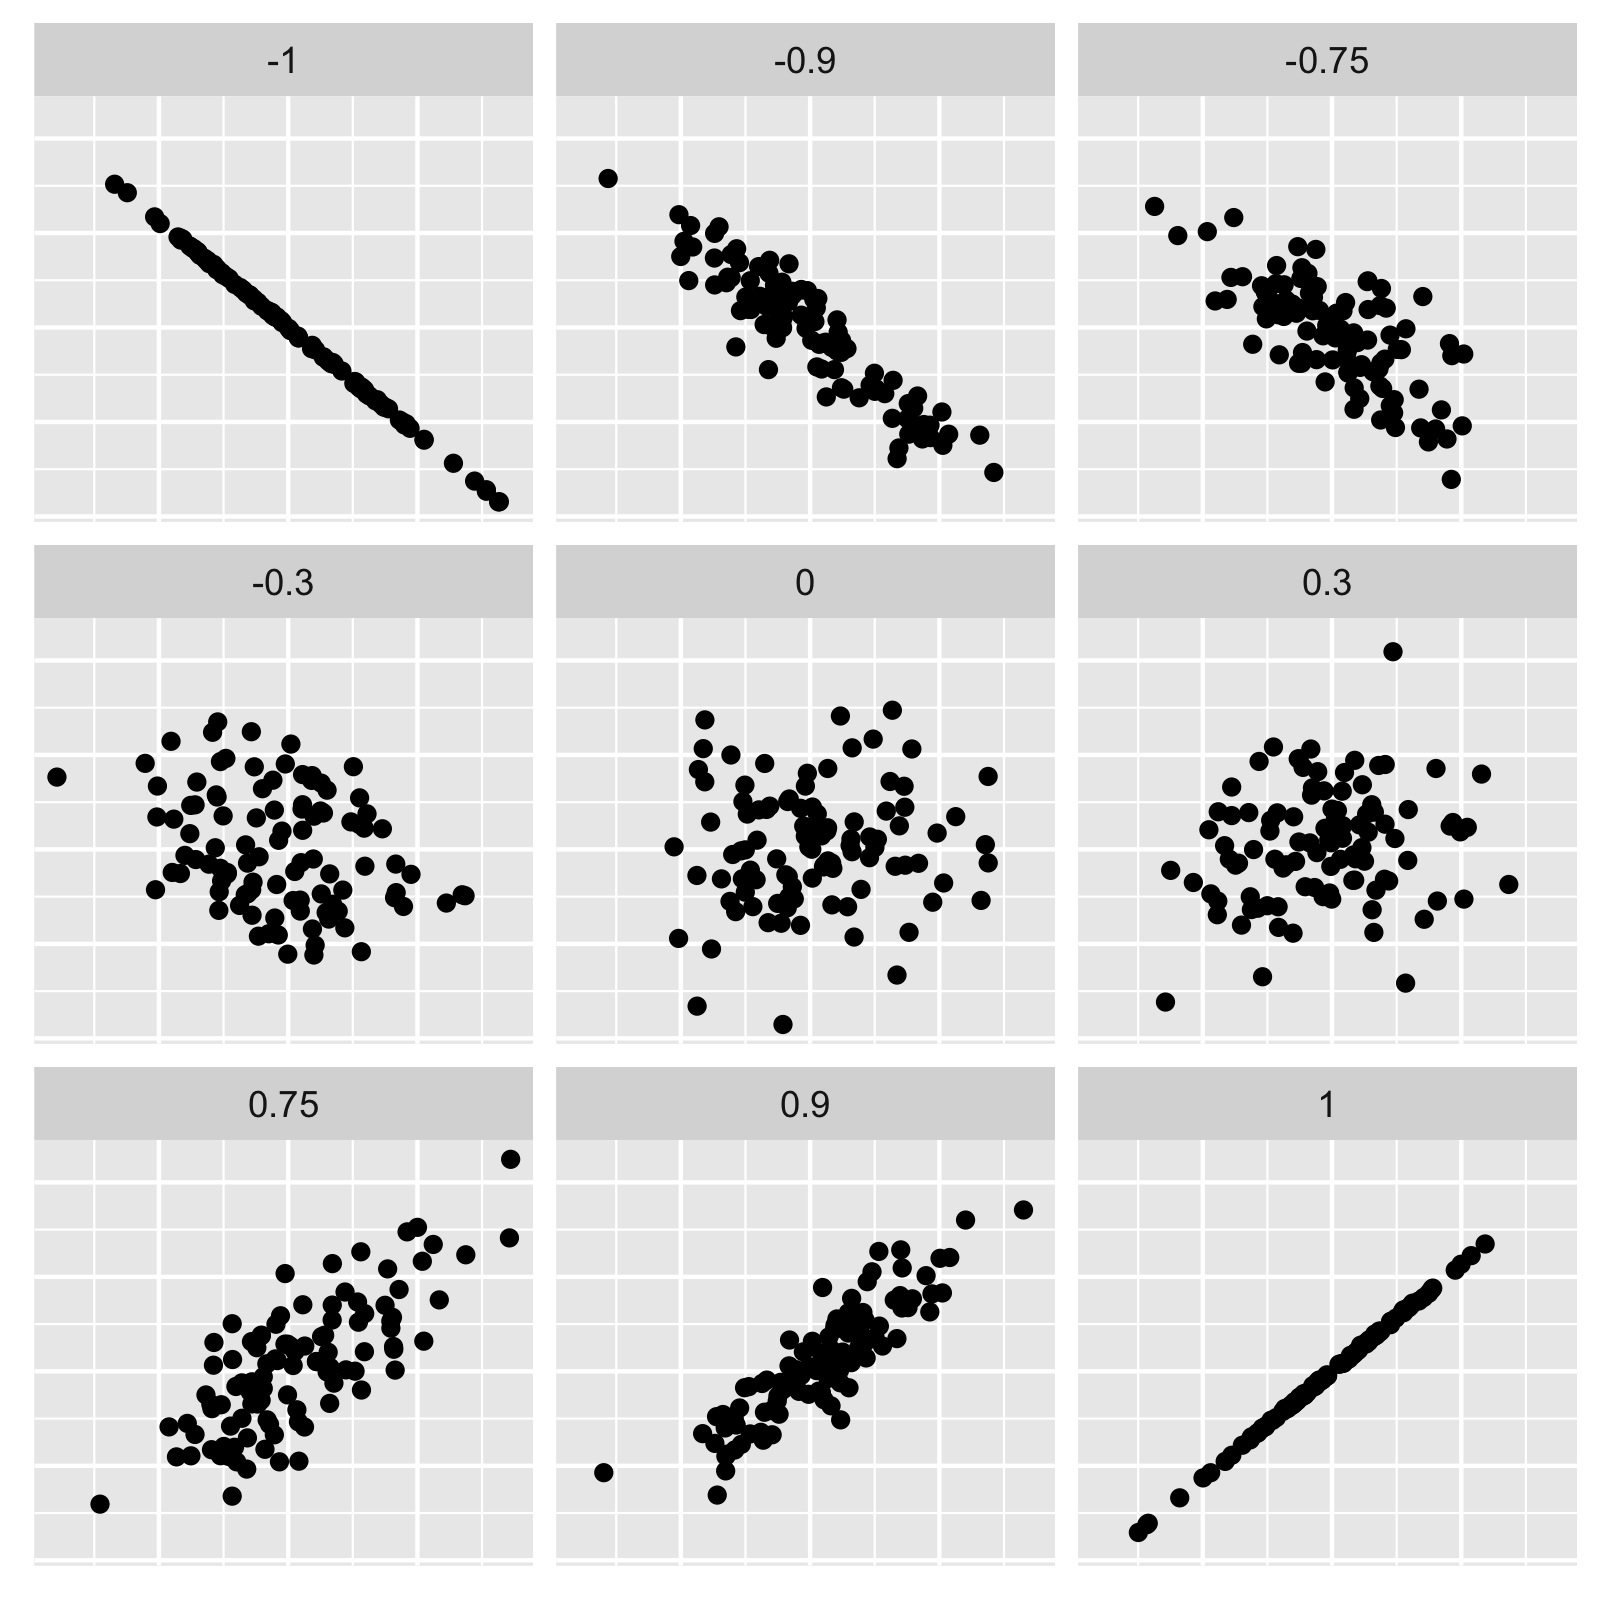
Correlation coefficient

Tidyverse में डेटा के साथ Modeling

Correlation coefficient निकालना

evals %>% 
  summarize(correlation = cor(score, age))
# A tibble: 1 x 1
  correlation
        <dbl>
1      -0.107
Tidyverse में डेटा के साथ Modeling

अभ्यास करते हैं!

Tidyverse में डेटा के साथ Modeling

Preparing Video For Download...