DESeq2 मॉडल

R में Bioconductor के साथ RNA-Seq

Mary Piper

Bioinformatics Consultant and Trainer

DESeq2 मॉडल
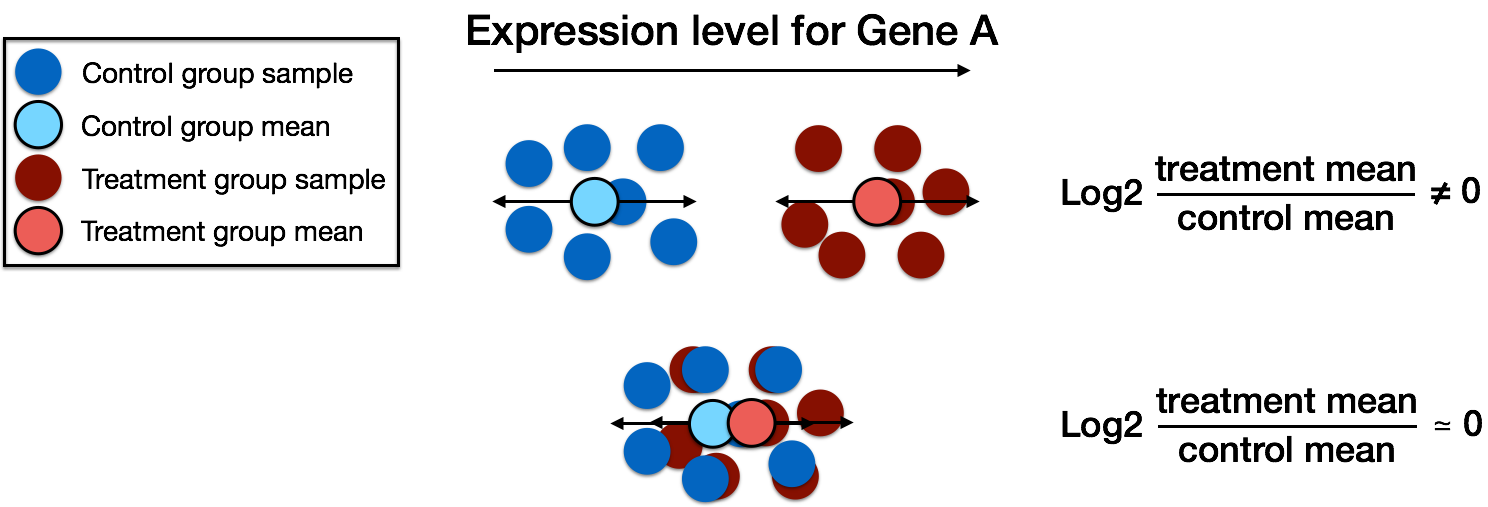
DE सिद्धांत

R में Bioconductor के साथ RNA-Seq

DESeq2 मॉडल - mean-variance संबंध

# Syntax for apply()
apply(data, rows/columns, function_to_apply)
# Calculating mean for each gene (each row)
mean_counts <- apply(wt_rawcounts[, 1:3], 1, mean)
# Calculating variance for each gene (each row)
variance_counts <- apply(wt_rawcounts[, 1:3], 1, var)
R में Bioconductor के साथ RNA-Seq

DESeq2 मॉडल - dispersion

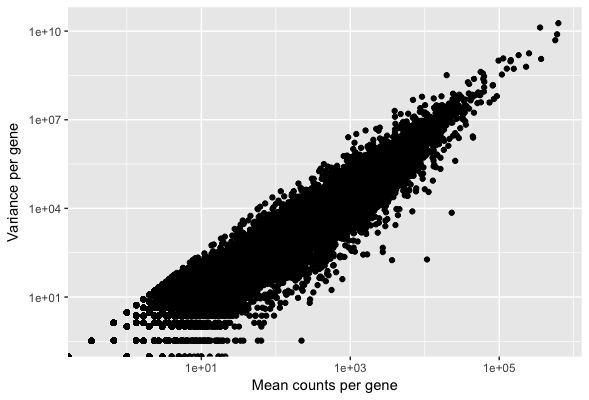
Mean और variance के बीच संबंध का प्लॉट:

# प्रत्येक जीन के mean और variance के साथ डेटा फ्रेम बनाएँ
df <- data.frame(mean_counts, variance_counts)
ggplot(df) +
        geom_point(aes(x=mean_counts, y=variance_counts)) + 
        scale_y_log10() +
        scale_x_log10() +
        xlab("Mean counts per gene") +
        ylab("Variance per gene")
R में Bioconductor के साथ RNA-Seq

DESeq2 मॉडल - dispersion

mean-variance संबंध

R में Bioconductor के साथ RNA-Seq

DESeq2 मॉडल - dispersion

$Var$: variance

$\mu$: mean

$\alpha$: dispersion

Dispersion सूत्र: $Var = \mu + \alpha * \mu^{2}$

Mean, variance और dispersion का संबंध:

$$\uparrow variance \Rightarrow \uparrow dispersion$$

$$\uparrow mean \Rightarrow \downarrow dispersion$$

R में Bioconductor के साथ RNA-Seq

DESeq2 मॉडल - dispersion

# Plot dispersion estimates
plotDispEsts(dds_wt)
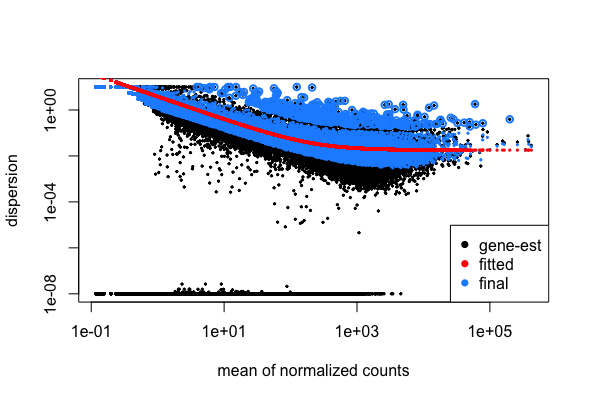
Dispersion प्लॉट

R में Bioconductor के साथ RNA-Seq

DESeq2 मॉडल - dispersion

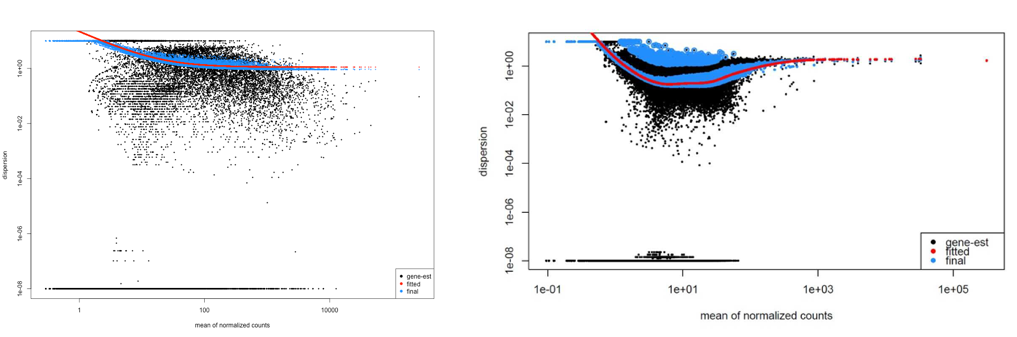
खराब dispersion प्लॉट्स

R में Bioconductor के साथ RNA-Seq

अभ्यास करते हैं!

R में Bioconductor के साथ RNA-Seq

Preparing Video For Download...