Seaborn परिचय
इंटरमीडिएट Data Visualization with Seaborn

Chris Moffitt
Instructor
Python Visualization लैंडस्केप
- Python की visualization लैंडस्केप जटिल है और भारी लग सकती है
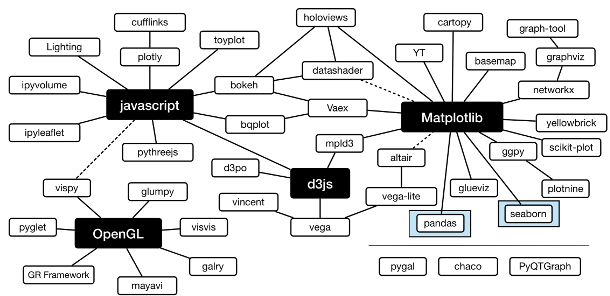
Matplotlib
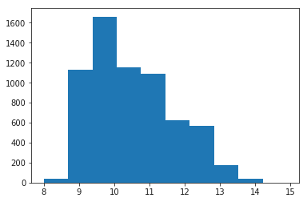
matplotlibSeaborn के विज़ुअलाइज़ेशन के लिए बेस बिल्डिंग ब्लॉक्स देता है- इसे अकेले भी डेटा प्लॉट करने के लिए उपयोग किया जा सकता है
import matplotlib.pyplot as plt import pandas as pddf = pd.read_csv("wines.csv")fig, ax = plt.subplots() ax.hist(df['alcohol'])
Pandas
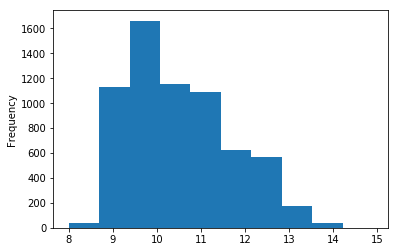
pandasडेटा विश्लेषण के लिए एक मूलभूत लाइब्रेरी है- यह बेसिक plotting क्षमता भी देता है
import pandas as pddf = pd.read_csv("wines.csv") df['alcohol'].plot.hist()
Seaborn histplot
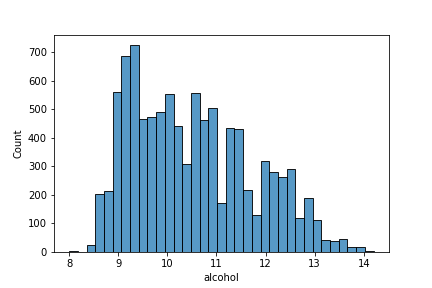
histplotपहले दिखाए गए histogram जैसा है- डिफ़ॉल्ट रूप से histogram बनाता है, लेकिन अन्य जटिल प्लॉट भी बना सकता है
import seaborn as snssns.histplot(df['alcohol'])
Seaborn displot
displotवितरण प्लॉट्स के लिएhistplotऔर अन्य फंक्शंस का लाभ उठाता है- डिफ़ॉल्ट रूप से histogram बनाता है, पर अन्य प्लॉट प्रकार भी बना सकता है
import seaborn as snssns.displot(df['alcohol'], kind='kde')
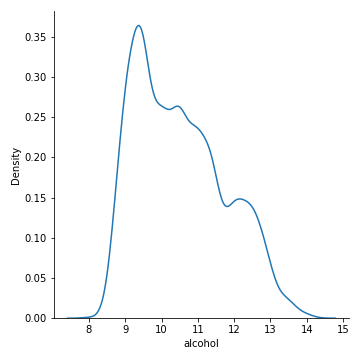
pandas Histogram बनाम Displot
- Pandas histogram
df['alcohol'].plot.hist()- ऑब्ज़र्वेशंस की वास्तविक आवृत्ति
- बार्स की कोई outline नहीं
- चौड़े bins
- x-axis लेबल नहीं
- Seaborn displot
sns.displot(df['alcohol'])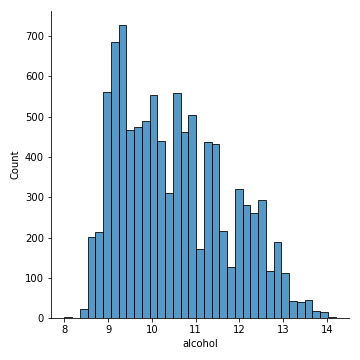
- x-axis पर ऑटो लेबल
- muted color palette
- साफ-सुथरा प्लॉट

