Seaborn में रंग
इंटरमीडिएट Data Visualization with Seaborn

Chris Moffitt
Instructor
प्लॉट के लिए रंग तय करना
- Seaborn में
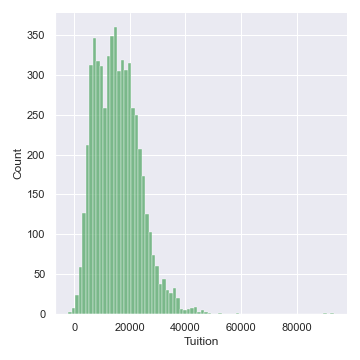
matplotlibके color codes से प्लॉट को रंग दे सकते हैं
sns.set(color_codes=True)
sns.displot(df['Tuition'], color='g')
पैलेट्स
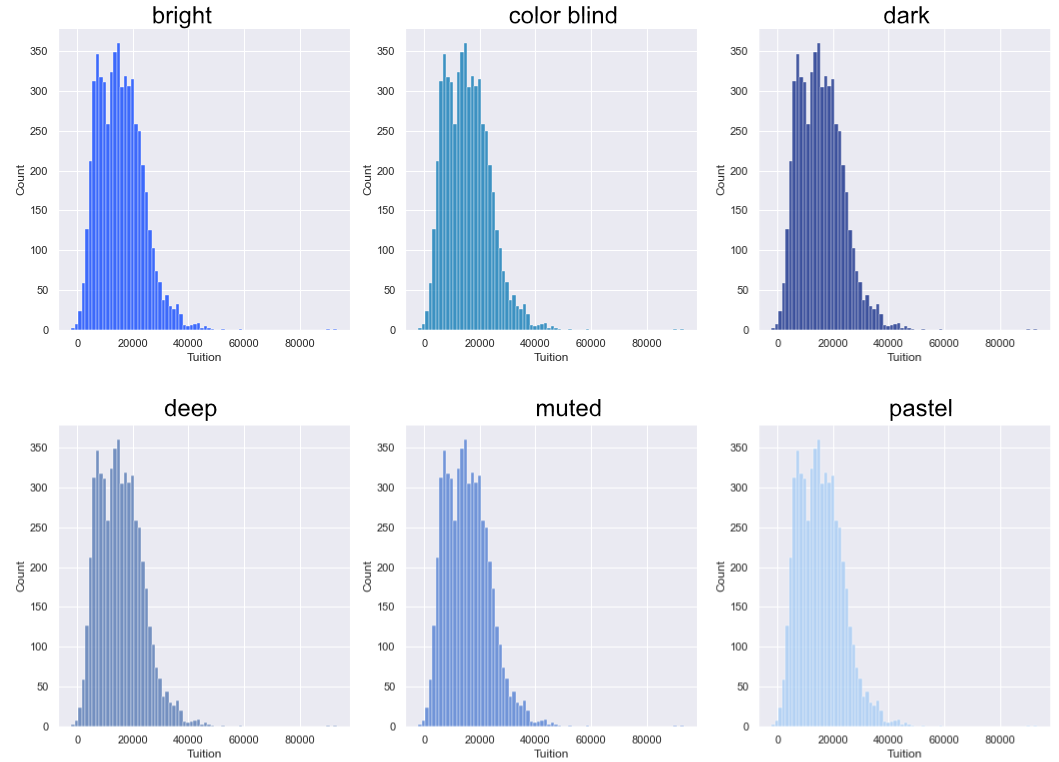
- पैलेट तय करने के लिए Seaborn का
set_palette()फंक्शन उपयोग करें
palettes = ['deep', 'muted', 'pastel', 'bright', 'dark','colorblind']
for p in palettes:
    sns.set_palette(p)
    sns.displot(df['Tuition'])
पैलेट दिखाना
sns.palplot()फंक्शन पैलेट दिखाता हैsns.color_palette()मौजूदा पैलेट लौटाता है
palettes = ['deep', 'muted', 'pastel', 'bright','dark','colorblind']
for p in palettes:
    sns.set_palette(p)
    sns.palplot(sns.color_palette())
    plt.show()

कस्टम पैलेट्स तय करना
- Circular colors = जब डेटा क्रमबद्ध न हो
sns.palplot(sns.color_palette("Paired", 12))

- Sequential colors = जब डेटा में high से low तक सतत रेंज हो
sns.palplot(sns.color_palette("Blues", 12))

- Diverging colors = जब low और high दोनों मान महत्वपूर्ण हों
sns.palplot(sns.color_palette("BrBG", 12))


