डिस्ट्रिब्यूशन प्लॉट का उपयोग
इंटरमीडिएट Data Visualization with Seaborn

Chris Moffitt
Instructor
हिस्टोग्राम बनाना
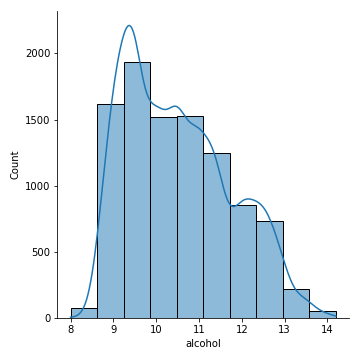
displotफंक्शन में कई वैकल्पिक आर्ग्युमेंट होते हैं- आप हिस्टोग्राम पर KDE प्लॉट ओवरले कर सकते हैं और बिन्स की संख्या तय कर सकते हैं
sns.displot(df['alcohol'], kde=True, bins=10)
वैकल्पिक डेटा डिस्ट्रीब्यूशन
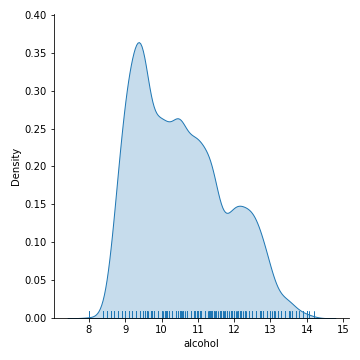
- रग प्लॉट, x-अक्ष पर छोटे टिकमार्क जोड़कर डेटा की डिस्ट्रीब्यूशन देखने का एक विकल्प है
- आप kde कर्व और रग प्लॉट को साथ जोड़ सकते हैं
sns.displot(df['alcohol'], kind='kde', rug=True, fill=True)
और प्लॉट प्रकार
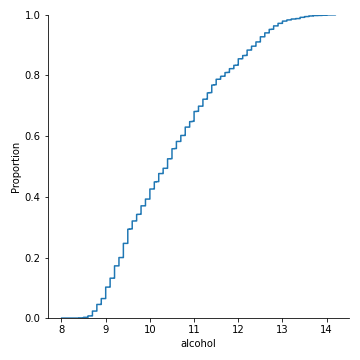
displotफंक्शन अंदरूनी तौर परkdeplot,rugplotऔरecdfplotजैसी फंक्शन का उपयोग करता हैecdfplotडेटा की cumulative distribution दिखाता है
sns.displot(df['alcohol'], kind='ecdf')