Regression Plots
इंटरमीडिएट Data Visualization with Seaborn

Chris Moffitt
Instructor
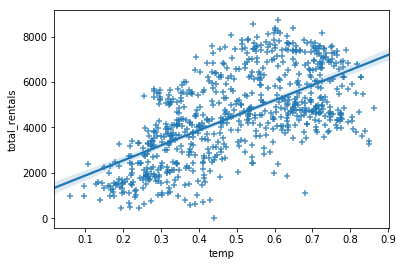
regplot() से प्लॉटिंग
sns.regplot(data=df, x='temp',
            y='total_rentals', marker='+')
residplot() से regression का मूल्यांकन
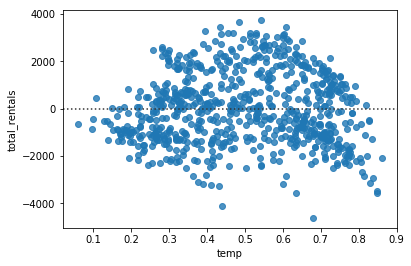
- किसी मॉडल की फिट जाँचने के लिए residual plot उपयोगी है
- Seaborn
residplotफंक्शन से सपोर्ट करता है
sns.residplot(data=df, x='temp', y='total_rentals')
Polynomial regression
- Seaborn
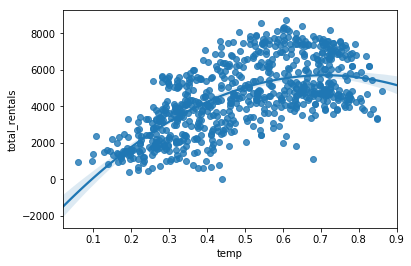
orderपैरामीटर से polynomial regression सपोर्ट करता है
sns.regplot(data=df, x='temp',
            y='total_rentals', order=2)
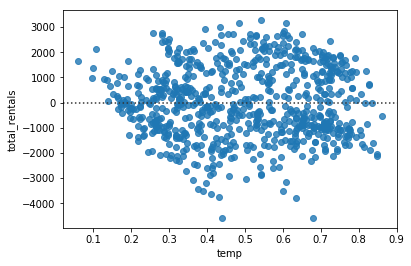
Polynomial regression के साथ residplot
sns.residplot(data=df, x='temp',
              y='total_rentals', order=2)
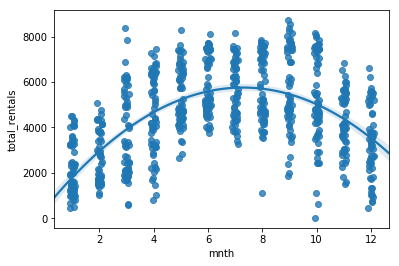
Categorical मान
sns.regplot(data=df, x='mnth', y='total_rentals',
            x_jitter=.1, order=2)
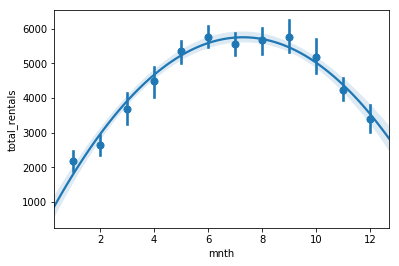
Estimators
- कुछ स्थितियों में ट्रेंड हाइलाइट करने हेतु
x_estimatorउपयोगी होता है
sns.regplot(data=df, x='mnth', y='total_rentals',
            x_estimator=np.mean, order=2)
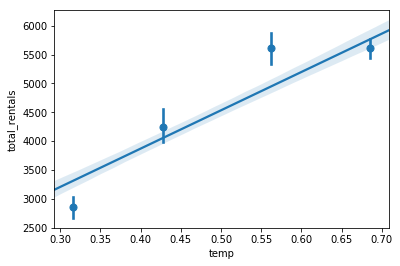
डेटा को बिन करना
x_binsसे डेटा को discrete bins में बाँट सकते हैं- रिग्रेशन लाइन अब भी पूरे डेटा पर फिट होती है
sns.regplot(data=df,x='temp',y='total_rentals',
            x_bins=4)