Regression और forecasting

Python में Bayesian डेटा विश्लेषण

Michal Oleszak

Machine Learning Engineer

Linear regression

$$y = \beta_0 + \beta_1x_1 + \beta_2x_2 + ...$$

$$\text{sales} = \beta_0 + \beta_1\text{marketingSpending}$$


  • Frequentist inference:

    • $\text{sales} = \beta_0 + \beta_1\text{marketingSpending} + \varepsilon$

    • $\varepsilon \sim \mathcal{N} (0, \sigma)$


  • Bayesian inference:

    • $\text{sales} \sim \mathcal{N} (\beta_0 + \beta_1\text{marketingSpending}, \sigma)$
Python में Bayesian डेटा विश्लेषण

Normal distribution

normal_0_1 = np.random.normal(0, 1, size=10000)


sns.kdeplot(normal_0_1, shade=True, label="N(0,1)") plt.show()

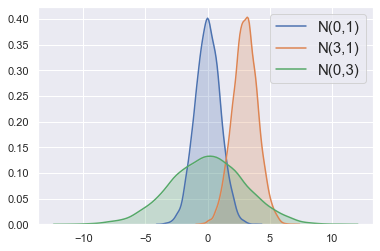
स्टैंडर्ड नॉर्मल डिस्ट्रीब्यूशन का घनत्व, 0 पर पीक और उसके आसपास सममित।

Python में Bayesian डेटा विश्लेषण

Normal distribution

normal_0_1 = np.random.normal(0, 1, size=10000)
normal_3_1 = np.random.normal(3, 1, size=10000)


sns.kdeplot(normal_0_1, shade=True, label="N(0,1)")
sns.kdeplot(normal_3_1, shade=True, label="N(3,1)")


plt.show()

नॉर्मल डिस्ट्रीब्यूशन का घनत्व, 3 पर पीक और सममित।

Python में Bayesian डेटा विश्लेषण

Normal distribution

normal_0_1 = np.random.normal(0, 1, size=10000)
normal_3_1 = np.random.normal(3, 1, size=10000)
normal_0_3 = np.random.normal(0, 3, size=10000)

sns.kdeplot(normal_0_1, shade=True, label="N(0,1)")
sns.kdeplot(normal_3_1, shade=True, label="N(3,1)")
sns.kdeplot(normal_0_3, shade=True, label="N(0,3)")

plt.show()

स्टैंडर्ड नॉर्मल डिस्ट्रीब्यूशन का घनत्व, 0 पर पीक और उसके आसपास सममित।

Python में Bayesian डेटा विश्लेषण

Bayesian regression मॉडल परिभाषा

$$\text{sales} \sim \mathcal{N} (\beta_0 + \beta_1\text{marketingSpending}, \sigma)$$

$$\beta_0 \sim \mathcal{N} (5, 2)$$

$$\beta_1 \sim \mathcal{N} (2, 10)$$

$$\sigma \sim \mathcal{Unif} (0, 3)$$


  • बिना किसी मार्केटिंग के हम $5000 sales$ की उम्मीद करते हैं.
  • खर्च में हर $1000$ बढ़ोतरी से sales में $2000$ बढ़ोतरी की उम्मीद है.
  • standard deviation के लिए uniform prior, क्योंकि हमें इसका अंदाज़ा नहीं.
Python में Bayesian डेटा विश्लेषण

Regression पैरामीटर का अनुमान

  • Grid approximation   →   कई पैरामीटर पर अव्यवहारिक
  • Conjugate priors चुनें और ज्ञात posterior से simulate करें   →   unintuitive priors
  • तीसरा तरीका: non-conjugate priors के साथ भी posterior से simulate करें!
  • फिलहाल मान लें कि parameter draws दिए गए हैं
Python में Bayesian डेटा विश्लेषण

Posterior प्लॉट करें

$$\text{sales} = \beta_0 + \beta_1\text{marketingSpending}$$

print(marketing_spending_draws)
array([9.6153, 8.9922, ..., 4.59565])
import pymc3 as pm

pm.plot_posterior(
  marketing_spending_draws, 
  hdi_prob=0.95
)

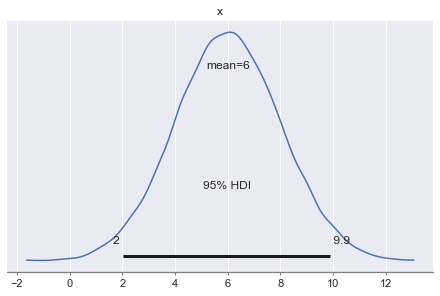
मीन और credible interval चिन्हित घनत्व प्लॉट।

Python में Bayesian डेटा विश्लेषण

Posterior draws विश्लेषण

posterior_draws_df = pd.DataFrame({
    "intercept_draws": intercept_draws,
    "marketing_spending_draws": marketing_spending_draws,
    "sd_draws": sd_draws
})

print(posterior_draws_df)
       intercept_draws  marketing_spending_draws      sd_draws
count     10000.000000              10000.000000  10000.000000
mean          2.972130                  5.999146      1.337621
std           3.008565                  2.020708      0.471723
min          -8.562093                 -2.842438      0.029643
25%           0.972832                  4.621807      1.003229
50%           3.002940                  5.975067      1.427617
75%           5.020615                  7.362572      1.736310
max          15.228549                 13.258955      1.999834
Python में Bayesian डेटा विश्लेषण

Predictive distribution

अगर हम मार्केटिंग पर $1000$ खर्च करें तो कितनी sales की उम्मीद है?
$\text{sales} \sim \mathcal{N} (\beta_0 + \beta_1\text{marketingSpending}, \sigma)$

# पैरामीटर के point estimates लें
intercept_mean = intercept_draws.mean()
marketing_spending_mean = marketing_spending_draws.mean()
sd_mean = sd_draws.mean()


# predictive distribution का mean निकालें predictive_mean = intercept_mean + marketing_spending_mean * 1000
# predictive distribution से simulate करें prediction_draws = np.random.normal(predictive_mean, sd_mean, size=10000)
Python में Bayesian डेटा विश्लेषण

Predictive distribution

अगर हम मार्केटिंग पर $1000$ खर्च करें तो कितनी sales की उम्मीद है?

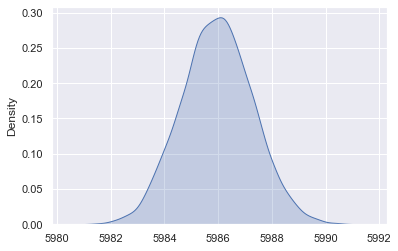
भविष्यवाणी की गई sales का घंटी-आकार घनत्व, लगभग 5986 पर पीक।

Python में Bayesian डेटा विश्लेषण

चलो regression और forecast करें!

Python में Bayesian डेटा विश्लेषण

Preparing Video For Download...