परिणाम समझना और मॉडलों की तुलना

Python में Bayesian डेटा विश्लेषण

Michal Oleszak

Machine Learning Engineer

मॉडल चलाना: पुनरावलोकन

formula = "num_clicks ~ clothes_banners_shown + sneakers_banners_shown"

with pm.Model() as model_1:
    pm.GLM.from_formula(formula, data=ads_aggregated)
    trace_1 = pm.sample(draws=1000, tune=500)
Python में Bayesian डेटा विश्लेषण

मॉडल चलाना: पुनरावलोकन

formula = "num_clicks ~ clothes_banners_shown + sneakers_banners_shown"

with pm.Model() as model_1:
    pm.GLM.from_formula(formula, data=ads_aggregated)
    trace_1 = pm.sample(draws=1000, tune=500, chains=4)
  • पैरामीटर की संख्या: 4
  • प्रत्येक पैरामीटर के लिए ड्रॉ की संख्या: 1000 $\times$ 4 = 4000
Python में Bayesian डेटा विश्लेषण

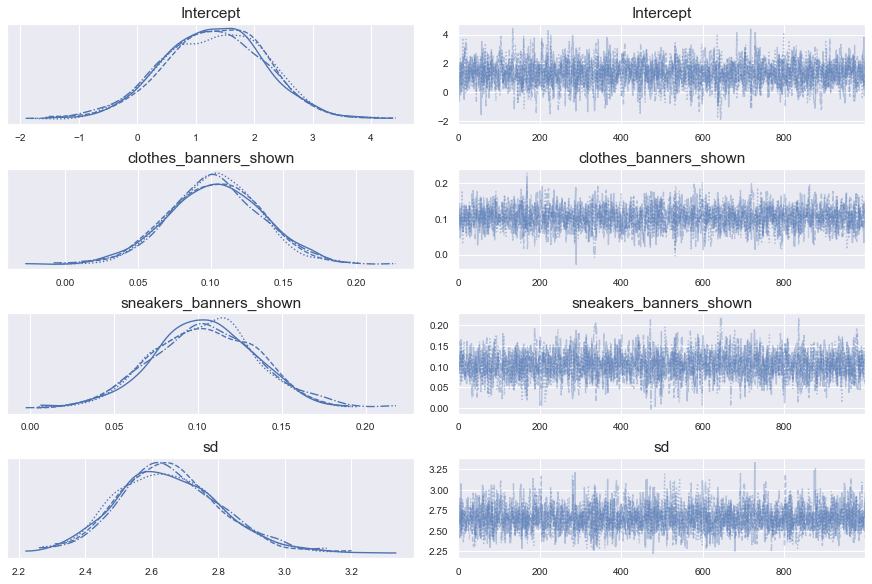
ट्रेस प्लॉट

pm.traceplot(trace_1)

दो कॉलम और चार पंक्तियों की ग्रिड: बाएँ कॉलम में चार डेन्सिटी प्लॉट, दाएँ में चार लाइन प्लॉट, प्रत्येक एक पैरामीटर के लिए।

Python में Bayesian डेटा विश्लेषण

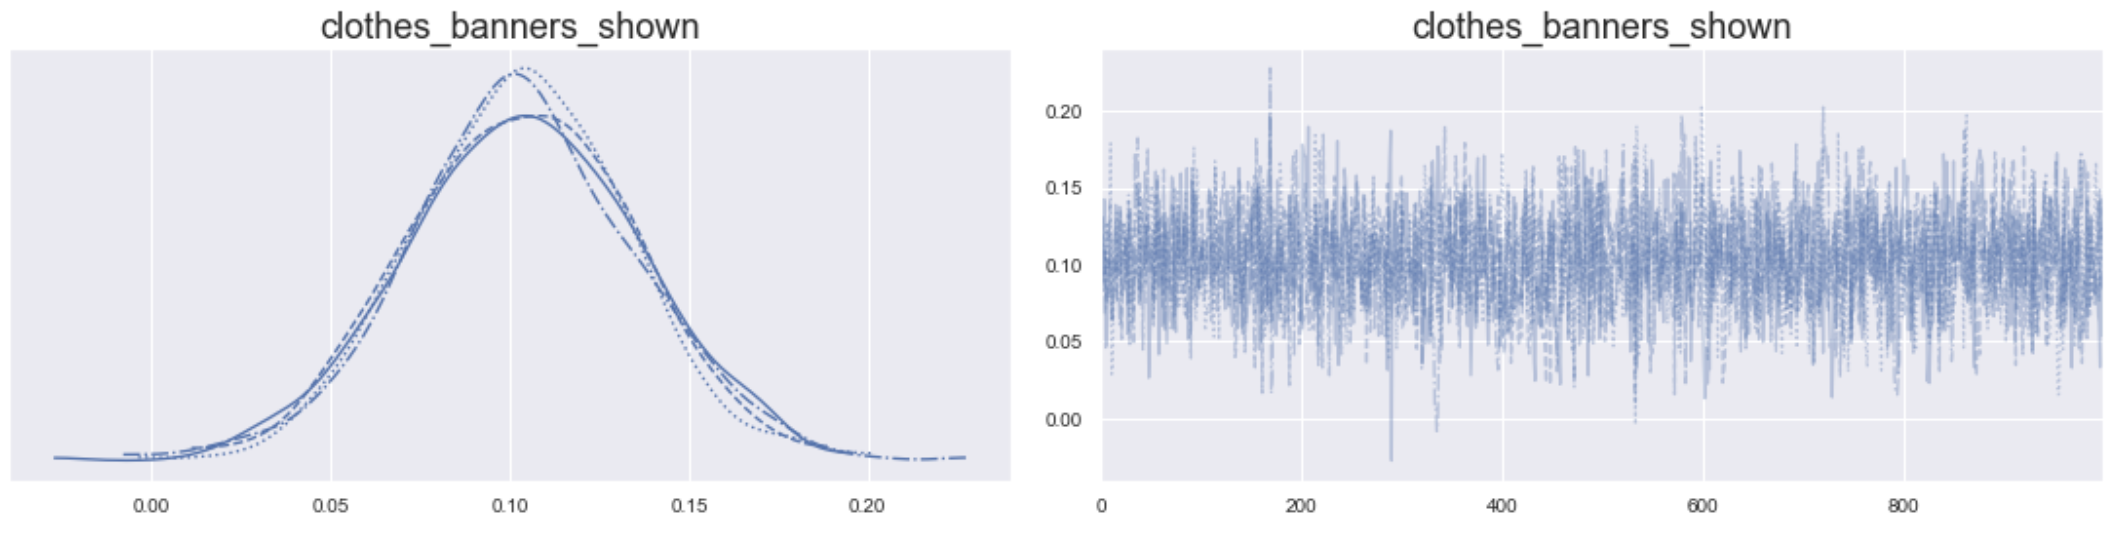
ट्रेस प्लॉट: एक पैरामीटर पर ज़ूम इन


दो प्लॉट साथ-साथ: बाएँ डेन्सिटी प्लॉट, दाएँ पैरामीटर ड्रॉ का लाइन प्लॉट।

Python में Bayesian डेटा विश्लेषण

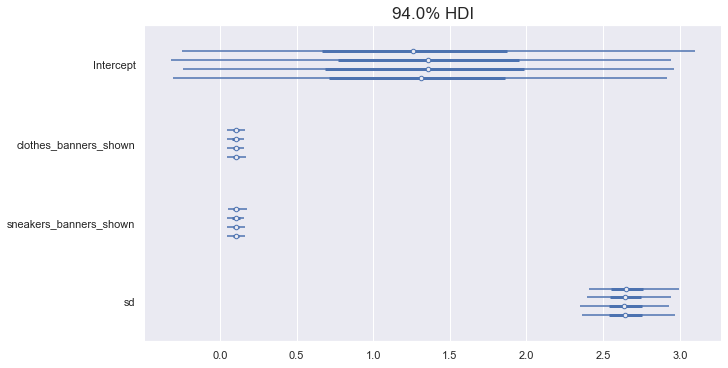
फॉरेस्ट प्लॉट

pm.forestplot(trace_1)

एक प्लॉट जो प्रत्येक मॉडल पैरामीटर के ड्रॉ के वितरण को क्षैतिज रूप में दिखाता है।

Python में Bayesian डेटा विश्लेषण

ट्रेस सारांश

pm.summary(trace_1)
                         mean     sd  hdi_3%  hdi_97%  mcse_mean  mcse_sd  \
Intercept               1.307  0.886  -0.305    2.962      0.018    0.013   
clothes_banners_shown   0.103  0.031   0.043    0.160      0.001    0.000   
sneakers_banners_shown  0.104  0.032   0.045    0.163      0.001    0.001   
sd                      2.654  0.157   2.382    2.970      0.003    0.002   

                        ess_mean  ess_sd  ess_bulk  ess_tail  r_hat  
Intercept                 2346.0  2318.0    2351.0    2083.0    1.0  
clothes_banners_shown     2085.0  2085.0    2089.0    1868.0    1.0  
sneakers_banners_shown    2105.0  1953.0    2122.0    1869.0    1.0  
sd                        2615.0  2590.0    2646.0    1834.0    1.0
Python में Bayesian डेटा विश्लेषण

दूसरा मॉडल फिट करना

formula = "num_clicks ~ clothes_banners_shown + sneakers_banners_shown + weekend"

with pm.Model() as model_2:
    pm.GLM.from_formula(formula, data=ads_aggregated)
    trace_2 = pm.sample(draws=1000, tune=500)
Python में Bayesian डेटा विश्लेषण

Widely Applicable Information Criterion (WAIC)

comparison = pm.compare({"trace_1": trace_1, "trace_2": trace_2}, 
                        ic="waic", scale="deviance")
print(comparison)
        rank     waic   p_waic    d_waic    weight       se      dse warning  \
trace_2    0   -362.8   5.1576         0  0.513792  9.37269        0    True   
trace_1    1 -362.926  4.13318  0.126236  0.486208  9.48352  1.50682    True   

        waic_scale  
trace_2        log  
trace_1        log
Python में Bayesian डेटा विश्लेषण

तुलना प्लॉट

pm.compareplot(comparison)
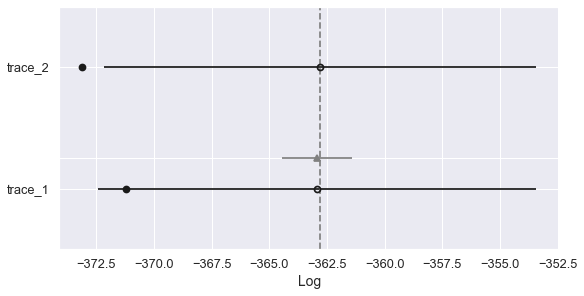
दो मॉडलों के लिए WAIC मान दिखाने वाला प्लॉट।

Python में Bayesian डेटा विश्लेषण

आइए मॉडलों की तुलना का अभ्यास करें!

Python में Bayesian डेटा विश्लेषण

Preparing Video For Download...